Simple example of using prometheus to track website uptime.
Prometheus is built in a modular, "microservice" like way.
This example runs some small docker containers, using docker-compose to wire them together. First, the "real" parts of the stack:
- The prometheus engine itself: Manages the state of all monitorables (in this case, the list of domains we care about monitoring)
- A process called blackbox-exporter which prometheus polls to actually execute the health checks
- An Alertmanager, which handles sending and managing state for alerts.
Then there are 3 small app containers that provide a simulation framework:
- alertlogger: Handles webhook-based alerts from Alertmanager and logs them to a file (
data/alertlogger/alerts.log) - flakyhost.com: A web server configured to intermittently fail then come back, so we can see the down/up alerting
- reliablehost.com: A web server which (tries) to always be reliable
To play with this, if you want to also probe some real sites, you can edit the config/blackbox_target.yml file and add actual domains as well.
Then, make sure you have docker-compose (and docker) installed and run
>>> This builds the containers for the simulation framework
$ docker-compose build

>>> start all the containers. Run without the `-d` if you want to see container logs.
$ docker-compose up -d

>>> keep an eye on the logs coming out over the alertmanager
$ tail -f data/alertlogger/alerts.log
Then go to http://localhost:9090/alerts in your browser to see what, if any hosts are alerting.
2016/11/19 15:30:57 Request from 172.18.0.6:54166: POST /
2016/11/19 15:30:57 {"receiver":"default-receiver","status":"resolved","alerts":[{"status":"resolved","labels":{"alertname":"SiteDown","instance":"flakyhost.com","job":"blackbox"},"annotations":{"description":"site down: flakyhost.com","summary":"site down: flakyhost.com"},"startsAt":"2016-11-19T15:28:27.818Z","endsAt":"2016-11-19T15:29:27.818Z","generatorURL":"http://b873f429a190:9090/graph?g0.expr=probe_success+%3C+1\u0026g0.tab=0"}],"groupLabels":{"alertname":"SiteDown"},"commonLabels":{"alertname":"SiteDown","instance":"flakyhost.com","job":"blackbox"},"commonAnnotations":{"description":"site down: flakyhost.com","summary":"site down: flakyhost.com"},"externalURL":"http://438350b8d0ba:9093","version":"3","groupKey":15335440397915075285}
2016/11/19 15:30:57 site down: flakyhost.com
2016/11/19 15:30:57 Status: resolved


2016/11/19 15:31:57 Request from 172.18.0.6:54216: POST /
2016/11/19 15:31:57 {"receiver":"default-receiver","status":"firing","alerts":[{"status":"firing","labels":{"alertname":"SiteDown","instance":"flakyhost.com","job":"blackbox"},"annotations":{"description":"site down: flakyhost.com","summary":"site down: flakyhost.com"},"startsAt":"2016-11-19T15:31:27.818Z","endsAt":"0001-01-01T00:00:00Z","generatorURL":"http://b873f429a190:9090/graph?g0.expr=probe_success+%3C+1\u0026g0.tab=0"}],"groupLabels":{"alertname":"SiteDown"},"commonLabels":{"alertname":"SiteDown","instance":"flakyhost.com","job":"blackbox"},"commonAnnotations":{"description":"site down: flakyhost.com","summary":"site down: flakyhost.com"},"externalURL":"http://438350b8d0ba:9093","version":"3","groupKey":15335440397915075285}
2016/11/19 15:31:57 site down: flakyhost.com
2016/11/19 15:31:57 Status: firing
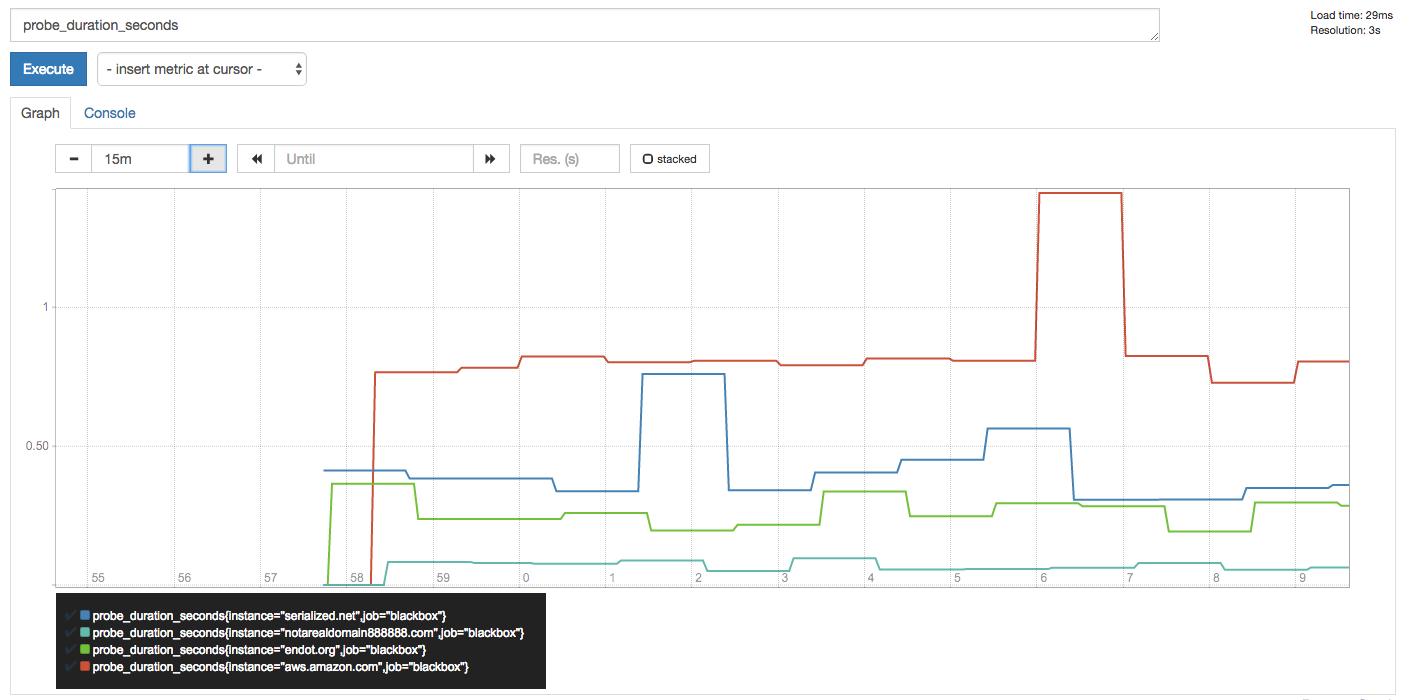
You can also see the other metrics that are tracked.
- Go to http://localhost:9090/graph
- Type
probe_then another name (probe_duration_secondsis an interesting one to see performance over time.)
These metrics could easily be added to a Grafana dashboard, as it has excellent Prometheus support.
For production use:
- Prometheus and the blackbox exporter can be run in multiple hosts (and/or multiple data centers)
- Alert manager can be run highly availably (they communicate with each other over a mesh protocol to block duplicate alerts)
- You can run Grafana or other dashboards and see other information (like response time, etc)
- Instead of a static
config/blackbox_targets.yml, a second container could be run to programatically fetch those lists from an external source, such as a database or external API, and update the file. (The contents are dynamically reloaded within 30 seconds as needed.) - Other types of probes (beyond HTTP) can be configured, the blackbox_exporter is hugely versatile.
For full documentation see
