Traffic Sign Recognition
Build a Traffic Sign Recognition Project
The goals / steps of this project are the following:
- Load the data set
- Explore, summarize and visualize the data set
- Augment the dataset
- Design, train and test a model architecture over an iterative process
- Use the model to make predictions on new images
- Analyze the top 5 softmax probabilities of the new images
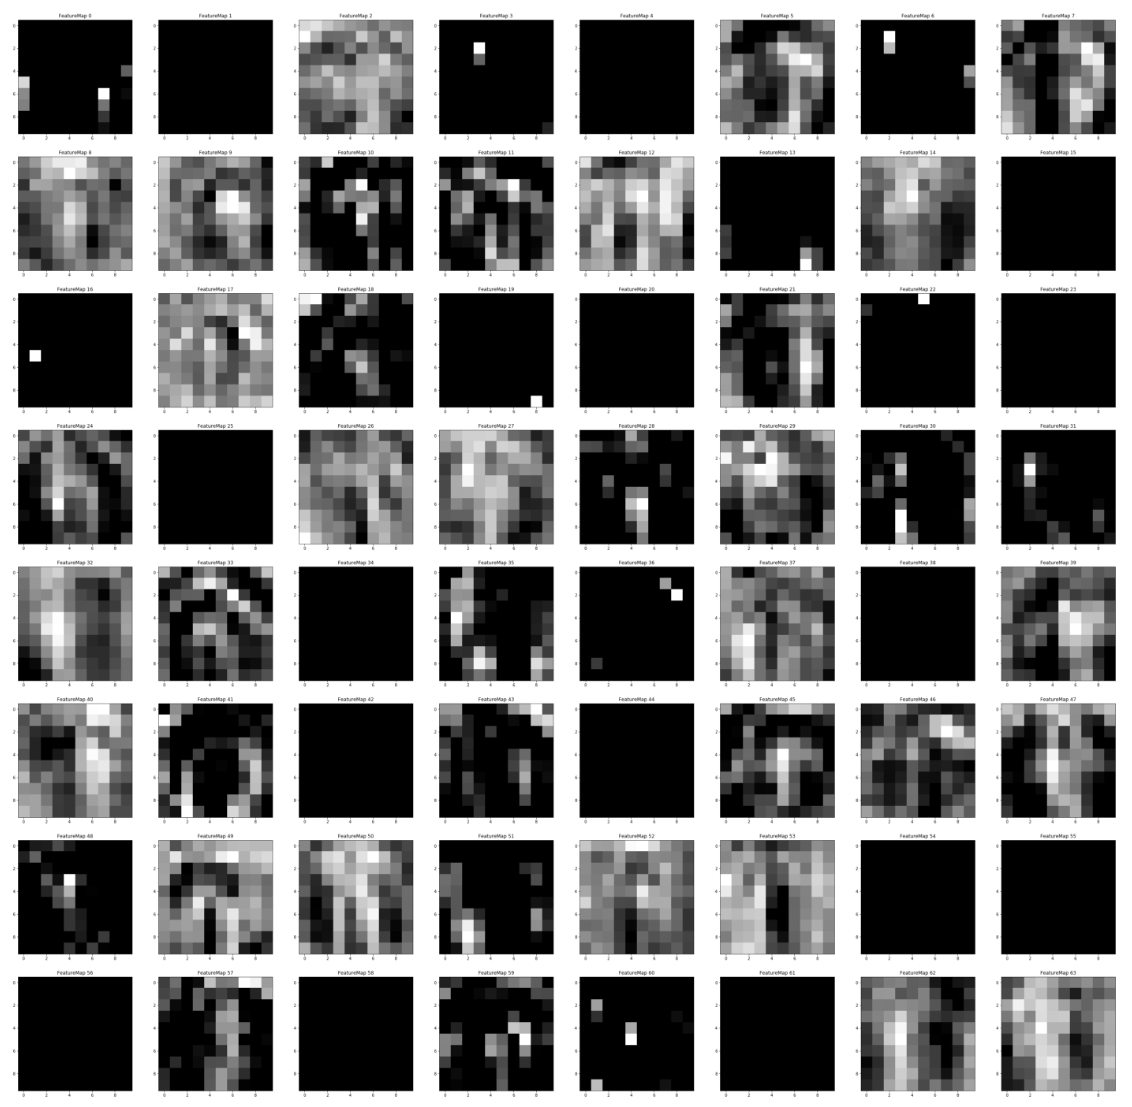
- Visualize the output of different convolution layers
Writeup / README
1. Data Set Summary & Exploration
I used the numpy library to calculate summary statistics of the traffic signs data set:
- The training set contains 34799 images
- The validation set contains 4410 images
- The test set contains 12630 images
- The shape of a traffic sign image is (32, 32, 3)
- The number of unique classes/labels in the data set is 43
2. Visualization of the dataset.
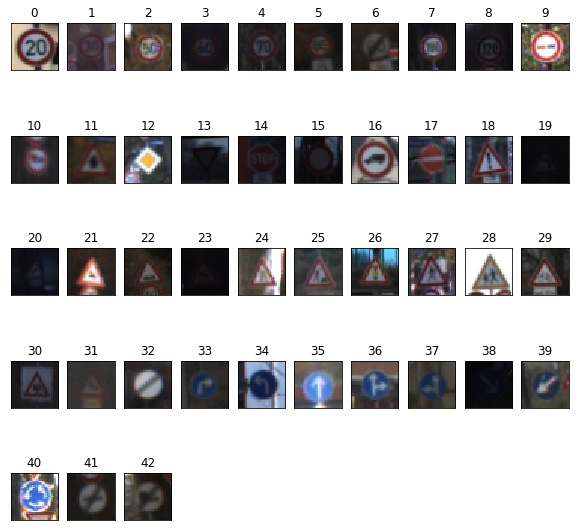
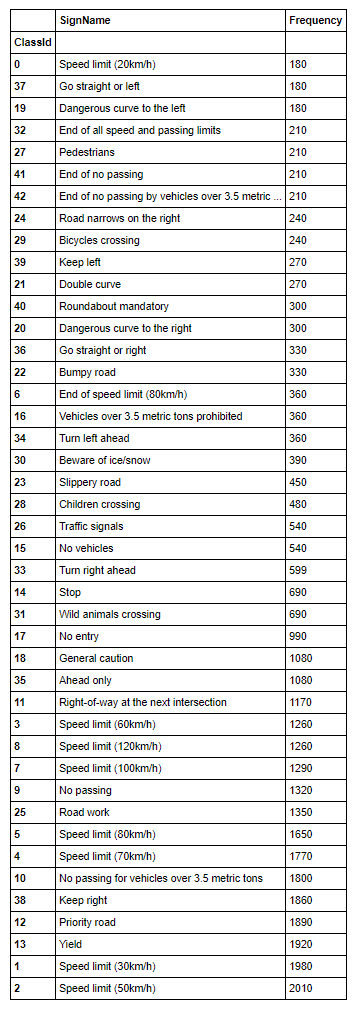
Here is an exploratory visualization of the data set. First 10 random images, then 1 example image of each class. Following 3 histogram bar charts showing how the train/validation/test data is distributed over the 43 classes and a table showing classID, name and frequency in the train set (ordered with frequency low -> high).
10 random images from the train set

1 image per class from the train set
Training set distribution

Validation set distribution

Test set distribution

Table with classID distribution
Design and Test a Model Architecture
1. Description of preprocessing the image data. What techniques were chosen and why?
I tried to train the network with 3 different preprocessing approaches:
- Plain RGB images (1)
- Histogram equalized images (2)
- Grayscale images (3)
Here is an example of 15 traffic sign images before and after histogram equalization or grayscaling, respectively.
As a last step before feeding the data to the network, I normalized the image data using Min-Max scaling.
if you generated additional data for training, describe why you decided to generate additional data, how you generated the data, and provide example images of the additional data. Then describe the characteristics of the augmented training set like number of images in the set, number of images for each class, etc.)
I decided to generate additional data because as seen in the data visualization section, the dataset is quite unbalanced. I tried to obtain a more balanced dataset to prevent the network from making biased predictions towards classes with plenty of images.
To add more data to the the data set, I used the following techniques:
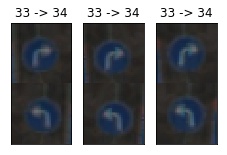
- (i) Flip images between 2 classes which are y-symmetric to each other (e.g. 36 <-> 37, ...)
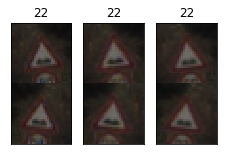
- (ii) Flip images of classes which are y-symmetric with themself (e.g. 30, ...)
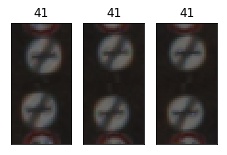
- (iii) Flip images (horizontal + vertical) of classes which are 180° rotation invariant
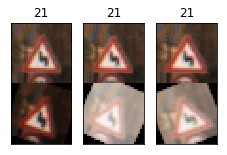
- (iv) Augment images of classes which are underrepresented in the train set (random rotate between -30°/+30° and change brightness with gamma correction)
Here are examples of original images vs. augmented images for all of the above described 4 cases:
(i)
(ii)
(iii)
(iv)
The new train set distribution looks like this:
Old

New

2. Describe what your final model architecture looks like including model type, layers, layer sizes, connectivity, etc.) Consider including a diagram and/or table describing the final model.
My final model consisted of the following layers:
| Layer | Description |
|---|---|
| Input | 32x32x3 RGB image |
| Convolution 5x5 | 1x1 stride, valid padding, outputs 28x28x24 |
| RELU | |
| Max pooling | 2x2 stride, outputs 14x14x24 |
| Convolution 5x5 | 1x1 stride, valid padding, outputs = 10x10x64 |
| RELU | |
| Max pooling | 2x2 stride, outputs = 5x5x64 |
| Convolution 3x3 | 1x1 stride, valid padding, outputs 3x3x64 |
| RELU | |
| Dropout | 0.5 |
| Fully connected | outputs 240 |
| Dropout | 0.5 |
| Fully connected | outputs 168 |
| Dropout | 0.5 |
| Fully connected | outputs 43 (=classes) |
| Softmax |
3. Describe the approach taken for finding a solution and getting the validation set accuracy to be at least 0.93. Include in the discussion the results on the training, validation and test sets and where in the code these were calculated. Your approach may have been an iterative process, in which case, outline the steps you took to get to the final solution and why you chose those steps. Perhaps your solution involved an already well known implementation or architecture. In this case, discuss why you think the architecture is suitable for the current problem.
The approach:
My first model I used was a plain LeNet model.

Source: Yann LeCun
This model does a quite good job at classifying handwritten characters/digits. So I decided to give it a shot at classifying traffic sign images. It turns out to be a good model and I sticked to it (with small modifications) till the end.
After training with the plain model for 10 Epochs and a learning rate of 0.01 I got the following results:
RGB images:
- training set accuracy of 0.967
- validation set accuracy of 0.881
Histogram equalized images:
- training set accuracy of 0.958
- validation set accuracy of 0.903
Grayscale images:
- training set accuracy of 0.970
- validation set accuracy of 0.883
In the following process I tried different filter sizes for both convolution layers and different numbers of neurons in the 1st and 2nd fully connected layers. Besides that, I tried adding a 3rd convolution layer. Further I trained the model on both augmented and not augmented data. I adjusted the learning rate and increased the number of epochs gradually. Additionally, I used dropout/early stopping to prevent more overfitting.
My final model results were:
- training set accuracy of 0.996
- validation set accuracy of 0.979
- test set accuracy of 0.955
To train the final model, I used a batch size of 512, 320 epochs (with early stopping) and dropout (0.5) after the 3rd convolution layer, 1st fully connected layer and 2nd fully connected layer. Besides that, I used adam optimizer with a learning rate of 0.001.
Test a Model on New Images
1. Choose five German traffic signs found on the web and provide them in the report. For each image, discuss what quality or qualities might be difficult to classify.
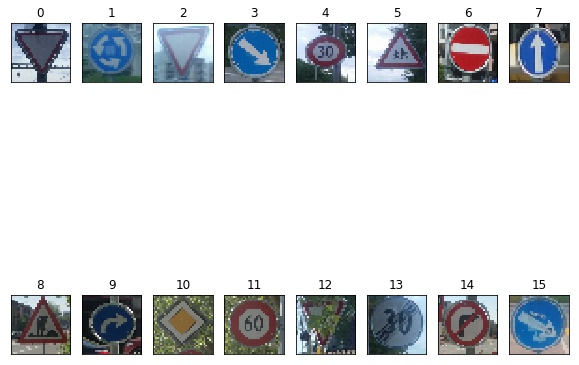
Here are 16 new traffic sign images I took in switzerland:
These are almost euqivalent/similar to german ones. The model could have some issues due to downscaling (32x32). I added some images which might be hard to classify because they are occupied by stickers or bushes (e.g. images 12,15). Images 13 and 14 do not belong to the orginal training classes.
2. Discuss the model's predictions on these new traffic signs and compare the results to predicting on the test set. At a minimum, discuss what the predictions were, the accuracy on these new predictions, and compare the accuracy to the accuracy on the test set (OPTIONAL: Discuss the results in more detail as described in the "Stand Out Suggestions" part of the rubric).
Here are the results of the prediction:
| Image | Prediction |
|---|---|
| Yield | Yield |
| Roundabout mandatory | Roundabout mandatory |
| Yield | Yield |
| Keep right | Keep right |
| Speed limit (30km/h) | Speed limit (30km/h) |
| Children crossing | Bicycles crossing |
| No entry | No entry |
| Ahead only | Ahead only |
| Road work | Road work |
| Turn right ahead | Turn right ahead |
| Priority road | Priority road |
| Speed limit (60km/h) | Speed limit (60km/h) |
| Yield | Yield |
| None | Speed limit (30km/h) |
| None | Dangerous curve to the right |
| Keep right | Keep right |
The model was able to correctly guess 13 of the 14 traffic signs (excluding 2 None classes), which gives an accuracy of 92.857%. This compares favorably to the accuracy on the test set of 95.5%.
3. Describe how certain the model is when predicting on each of the five new images by looking at the softmax probabilities for each prediction. Provide the top 5 softmax probabilities for each image along with the sign type of each probability. (OPTIONAL: as described in the "Stand Out Suggestions" part of the rubric, visualizations can also be provided such as bar charts)
The code for making predictions (top 5 softmax) on my final model is located at the end of the Ipython notebook. The 16 images can be found in the "new_images/" directory or as a pickled file in the "data/" directory.
(Optional) Visualizing the Neural Network (See Step 4 of the Ipython notebook for more details)
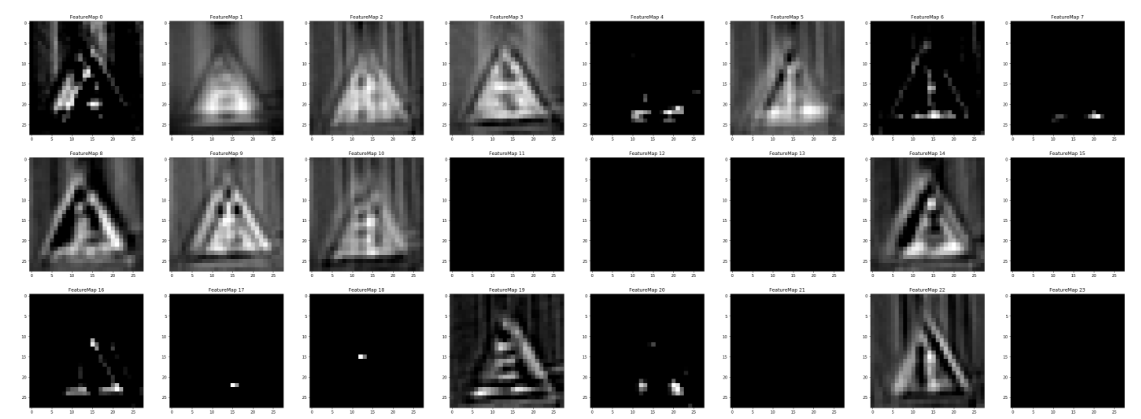
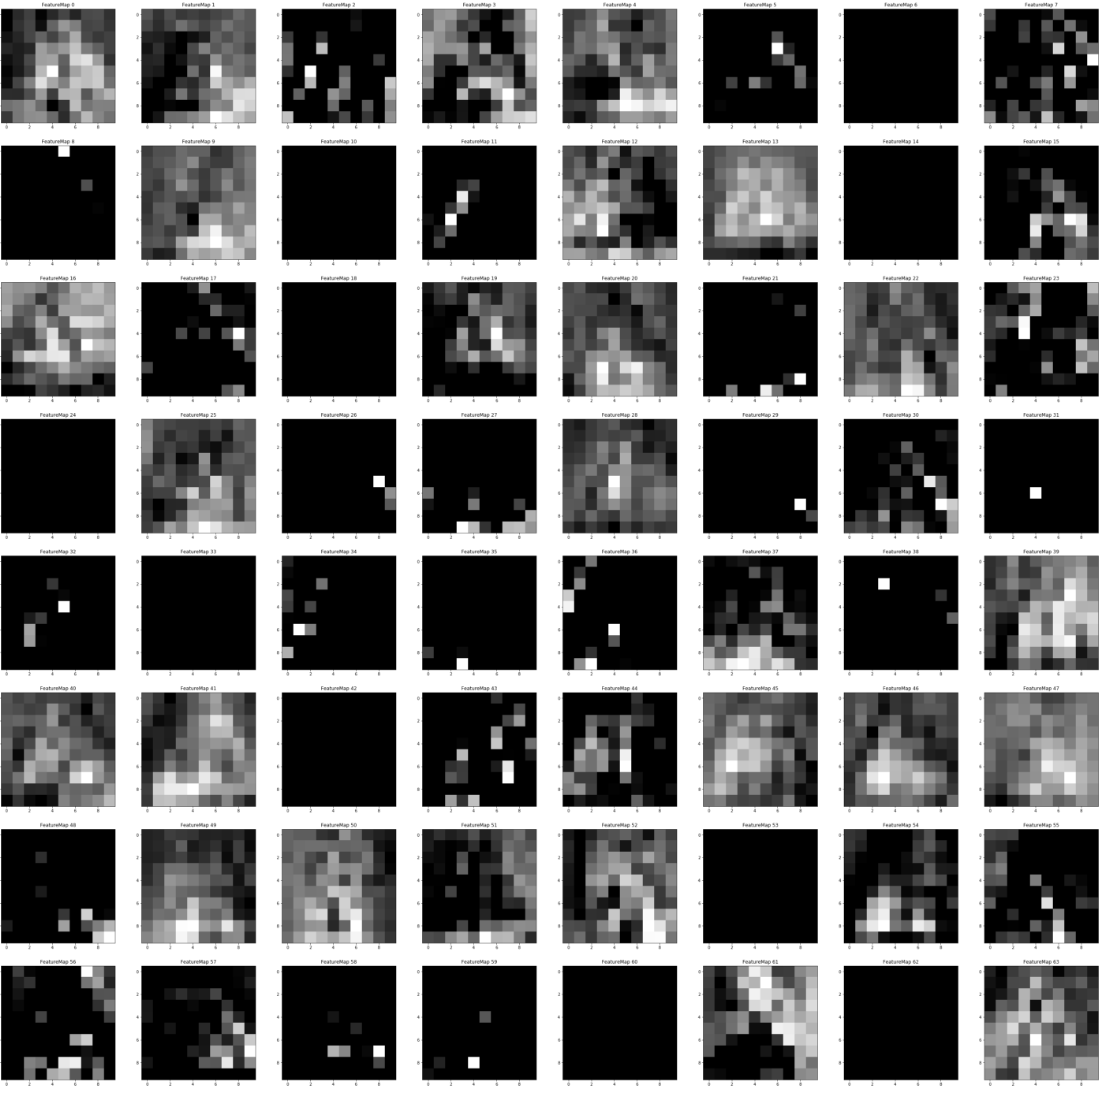
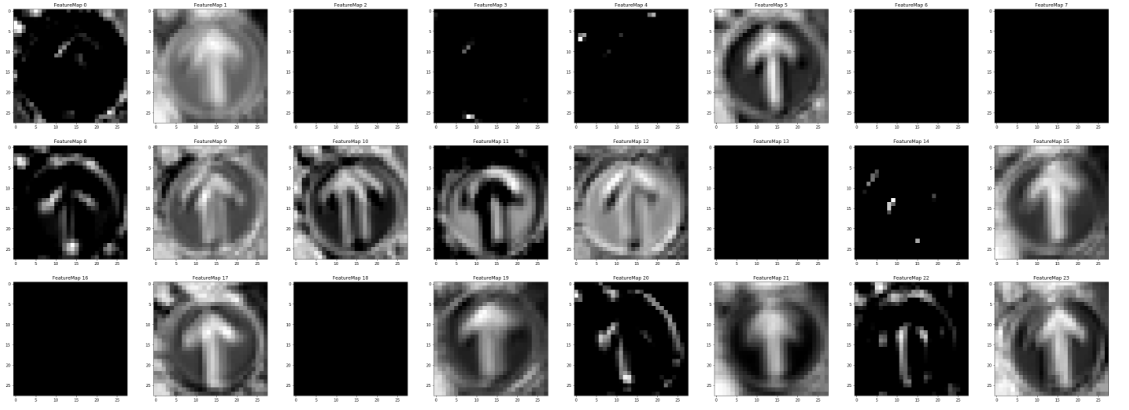
1. Discuss the visual output of your trained network's feature maps. What characteristics did the neural network use to make classifications?
Example 1

1 Layer Activation
2 Layer Activation
Example 2

1 Layer Activation
2 Layer Activation
