Random Portfolio Generation vs Benchmark Strategy
Overview
Building on the popular quote from the book "A Random Walk Down Wall Street" by economist Burton Malkiel that, as explained here:
"a blindfolded monkey throwing darts at a newspaper's financial pages could select a portfolio that would do just as well as one carefully selected by experts."
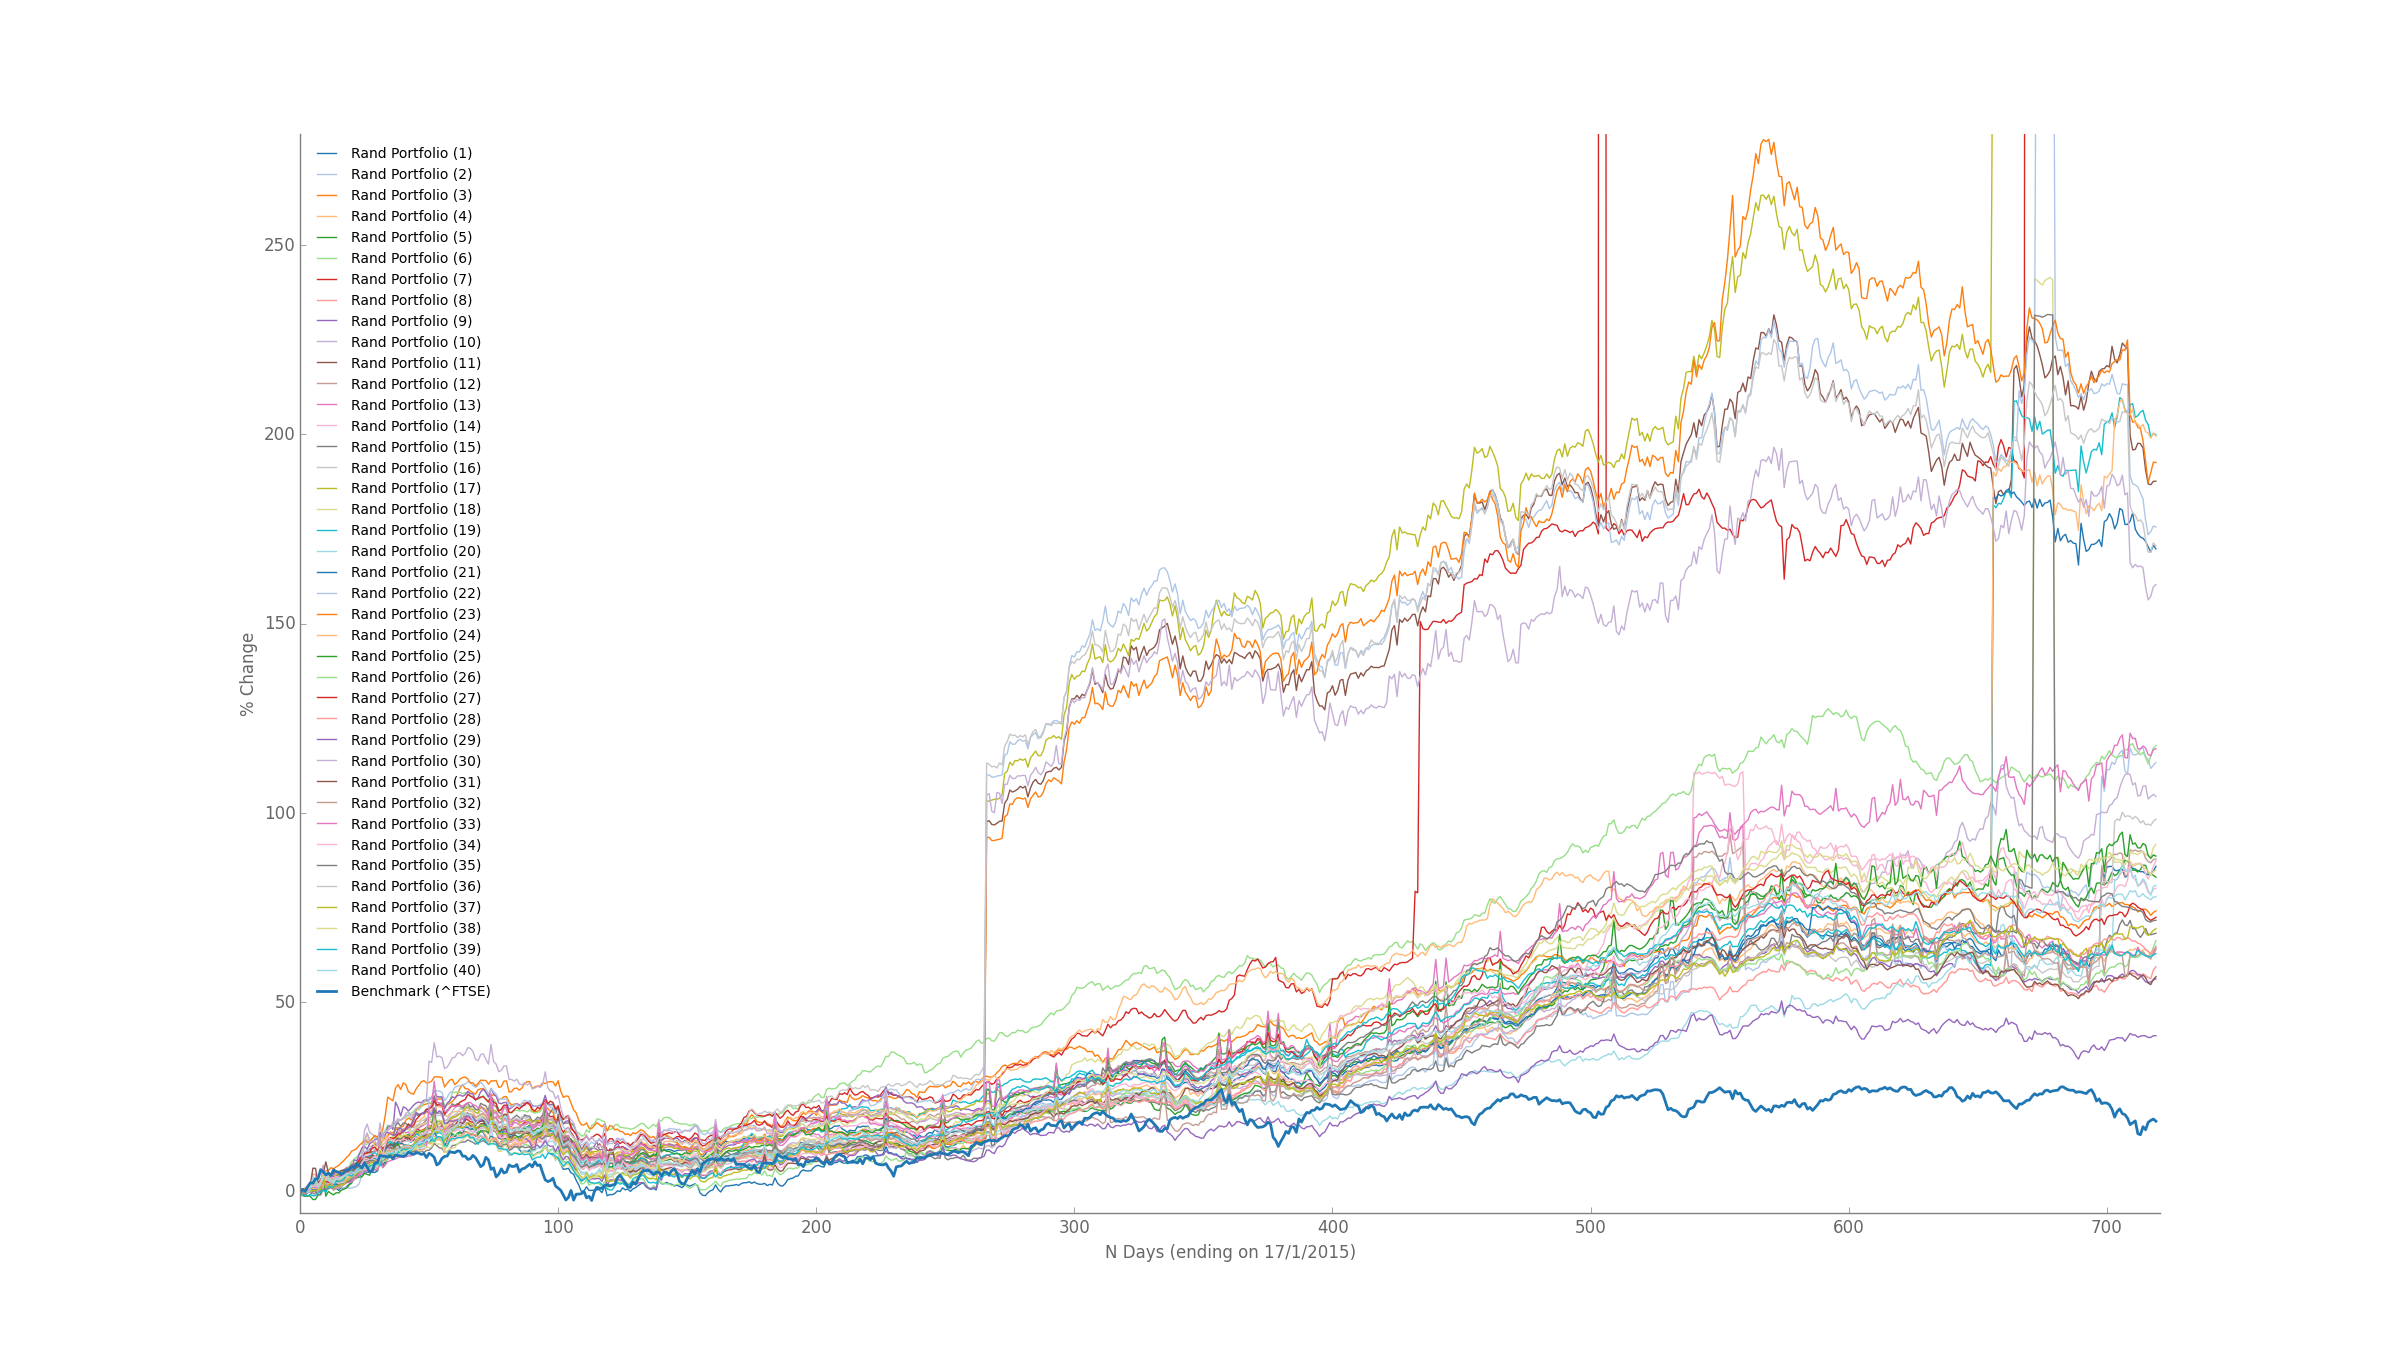
I set out to see if a randomly generated portfolio could beat a benchmark index.
This Python project models the performance of randomly generated portfolios and plots them against a benchmark. The aim is to visualise if randomly picked portfolios with the same number of constituent stocks as the benchmark index can outperform the benchmark itself.
To rather than just having a singular comparison at a time, my strategy allows for generation of an arbitrary number of random portfolios, all consisting of a specified number of equally weighted constituents, hence turning the experiment into a Monte Carlo Simulation which then gets plotted on a single graph using the matplotlib library.
Technical Info
-
The list of stocks to randomly pick from for a portfolio is contained under ./data/ and consists of a comma delimited file in the format: YAHOO TICKER, COMPANY NAME, INDUSTRY, COUNTRY TRADED, EXCHANGE with the first line being the above heading.
-
The program uses the Yahoo Finance historical prices download link to fetch CSV files of the historical prices of each stock. As some stocks don't have historical prices, or contain limited history, the program deals with this by iterating through the provided stocklist and trying the next random stock until it finds one that satisfies the historical requirements.
-
The randomly generated portfolios are outputted to a comma delimited file called rand_portfolios.csv which lists the Yahoo Finance tickers of the constituents of each portfolio.
-
Matplotlib line graph styling is done via the mpl_graph_line.py class and uses the Tableau20 colours for a more appealing visual.
Example Output