This is a simple tool to monitor network connectivity between nodes and display a graph.
The gridbug.py service pulls in a list of other GridBug nodes. It then proceeds to poll each of these nodes and records the state (link up or down).
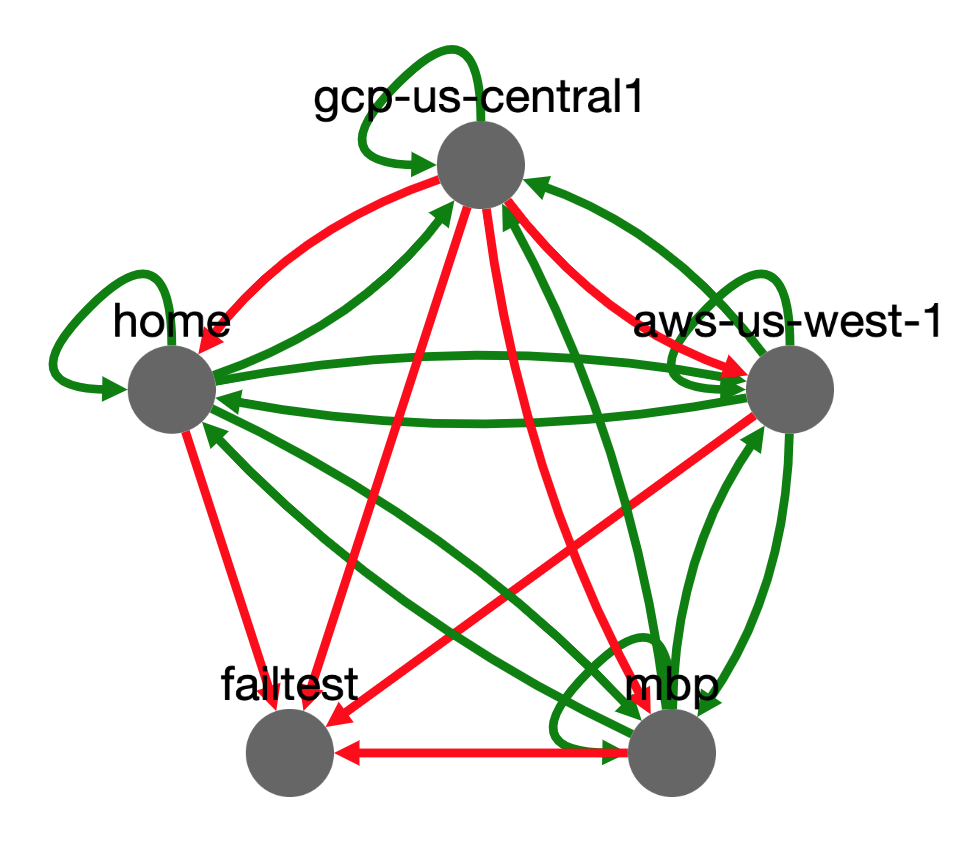
All of the GridBug nodes act as servers and clients. Every node attempts to converge on the same graph by polling and sharing updates with each other. Each node builds a directional graph of connectivity between all the GridBug nodes and renders that as an HTML page using the cytoscape JavaScript visualization library.
The script can run as a serverless container, a hosted container or as a standalone (python) service.
The service will run by setting local environmental variables for the node. This will make it easy to run in a serverless fashion (tested in AWS Fargate, Google Cloud Run, and Azure ACI):
Use Container: jasonacox/gridbug
# Set these environmental variables
BUGLISTURL="https://jasonacox.com/gridbugs.json"  # URL to gridbugs.json seed file
GB_ID="cloud-us-west"                             # Short descriptive name for this node
GB_DEBUG="no"                                     # Debug mode yes/no
GB_NODEURL="autodiscover"                         # or Address/IP:PORT for this node
GB_GRIDKEY="RaNdomKeY-4-your-Grid"                # Unique key for your grid network
Using "autodiscover" the node will attempt to discover its own public IP address. If you are using an application load balancer or gateway, specify the DNS address or public IP address and port instead (e.g. 10.20.30.40:8777).
Cloud Serverless tips:
- AWS ECS - When you create an Fargate service (task definition), you will need to specify the environmental variables (container overrides) as shown above.
- Google Cloud Run - You will need to specify the port (8777) and create a vpc-connector to get a static address for your instance (see here). Deploy a test and it will provide an https address that you will use as the
GB_NODEURLwithout the port (edit and deploy new revision with that environmental update). - Azure ACI - You will need to do a test deploy to get the URL of the container. Once you have that, you will use that as the
GB_NODEURLwith the port suffix (:8777).
A setup.sh script is available to help get you started.
-
ID - Every GridBug node needs a unique
IDthat will show up on the visualization. Make this descriptive enough to identify where it is on the grid. For example, 'CA-datacenter' and 'East-1-Cloud'. Each node will also need a URL (hostname:8777) that is accessible by the other GridBug nodes. -
GRIDKEY - You will need to set a unique key (string of alphanumeric characters without spaces) for your grid network. This will be a shared key by all the GridBug nodes to authenticate other friendly GridNodes. This allow for dynamically adding new nodes to the grid as well.
# Clone the Project
git clone https://github.com/jasonacox/gridbug.git

# Run the Setup script
cd gridbug
./setup.sh

# Open http://hostname:8777 to see the GridBug console
-
Create a
gridbug.conffile (example below) and update with your specific location details. Make sure you updateIDto be the unique name of the node. -
The
GRIDKEYtoken should be a unique key (string of alphanumeric characters). It should be the same for all the GridBug nodes in your network. GridBug will reject any updates from nodes that do not match this key.
-
gridbug.conf - Configuration File
[GRIDBUG] DEBUG = no ID = localhost NODEURL = example.com:8777 ROLE = node CONSOLE = gridbug.html SERVERNODE = localhost:8777 GRIDKEY = CRuphacroN2hOfachlsWipaxi4ude1rlbIn4v0Vispiho7tuWeSPADrUdR2pE0rl [API] # Port for API requests ENABLE = yes PORT = 8777 [BUGS] POLL = 10 TTL = 30 TIMEOUT = 10 [ALERT] # Notify connectivity issues - TODO ENABLE = yes- Note: There are environmental overrides that can be used to set all of the above configuration options.
-
Create a
gridbugs.jsonseed file and add some nodes for your grid. Thehostis the address and should include the port (e.g.:8777) whereidis the unique name of the node (matching gridbug.confID) for each node.{ "version": 1, "gridbugs": [{ "host": "ptr.example.com:8777", "id": "jasonacox.com" }, { "host": "10.0.1.2:8777", "id": "LAN" }, { "host": "localhost:8777", "id": "origin" }] }- Note: This does not need to be the complete list of GridBugs in your network as GridBug will propagate discovered notes across the grid. If
hostandidare missing for the local node, it will automatically addIDandNODEURLfrom above config.
- Note: This does not need to be the complete list of GridBugs in your network as GridBug will propagate discovered notes across the grid. If
-
Run the Docker Container to listen on port 8777.
docker run \
-d \
-p 8777:8777 \
-e GRIDBUGCONF='/var/lib/gridbug/gridbug.conf' \
-e GRIDBUGLIST='/var/lib/gridbug/gridbugs.json' \
-v ${PWD}:/var/lib/gridbug:ro \
--name gridbug \
--user ${UID} \
--restart unless-stopped \
jasonacox/gridbug
-
View the GridBug Console and API Calls
Console: http://localhost:8777/
# Get Version and Status
curl -i http://localhost:8777/stats

# Get Current Weather Data
curl -i http://localhost:8777/text   # Text version of console
curl -i http://localhost:8777/bugs   # List of gridbug nodes
curl -i http://localhost:8777/graph  # nternal graph of connectivity (JSON)
Alternatively, you can just run the python server from a startup script:
# Create gridbug.conf and gridbugs.json file or set these:
# environmental variables
export BUGLISTURL="https://jasonacox.com/gridbugs.json"  # URL to gridbugs.json file
export GB_ID="cloud-us-west"                             # Name for this node
export GB_DEBUG="no"                                     # Debug mode yes/no
export GB_NODEURL="jasoncox.com:8777"                    # Address/IP:PORT for this node
export GB_GRIDKEY="RaNdomKeY-4-your-Grid"                # Unique key for your grid network

# Start
python3 gridbug.py GRIDBUGCONF = Path to gridbug.conf config file
GRIDBUGLIST = Path to gridbugs.json node list
* BUGLISTURL = URL to gridbugs.json (overrides config)
GB_DEBUG = Set to debug mode (yes/no)
GB_ROLE = node or server (defaults node)
* GB_ID = Node ID
* GB_NODEURL = The URL address to this node (e.g. 10.10.10.10:8777)
GB_CONSOLE = HTML file for console
GB_SERVERNODE = Default node to test
* GB_GRIDKEY = Private key for grid (overrides above)
GB_IPSERVICE = Service that provide your public IP
GB_APIPORT = TCP Port to Listen (defaults 8777)
GB_MAXPAYLOAD = Maximum allowed POST payload to accept
GB_POLL = Time in seconds to wait between tests
GB_TTL = Time in seconds to identify dead node
GB_TIMEOUT = Time in seconds to wait for response
    The API service of gridbug has the following functions:
        /           - GridBug Console - displays graph of nodes
        /text       - Human friendly display of current conditions
        /bugs       - List of gridbug nodes
        /stats      - Internal gridbug metrics
        /graph      - Internal graph of connectivity (JSON)
        /clear      - Reload gridbugs and rebuild graph
        /ping       - Simple OK response
        /time       - Local timestamps and uptime
        /raw        - Raw graph DB