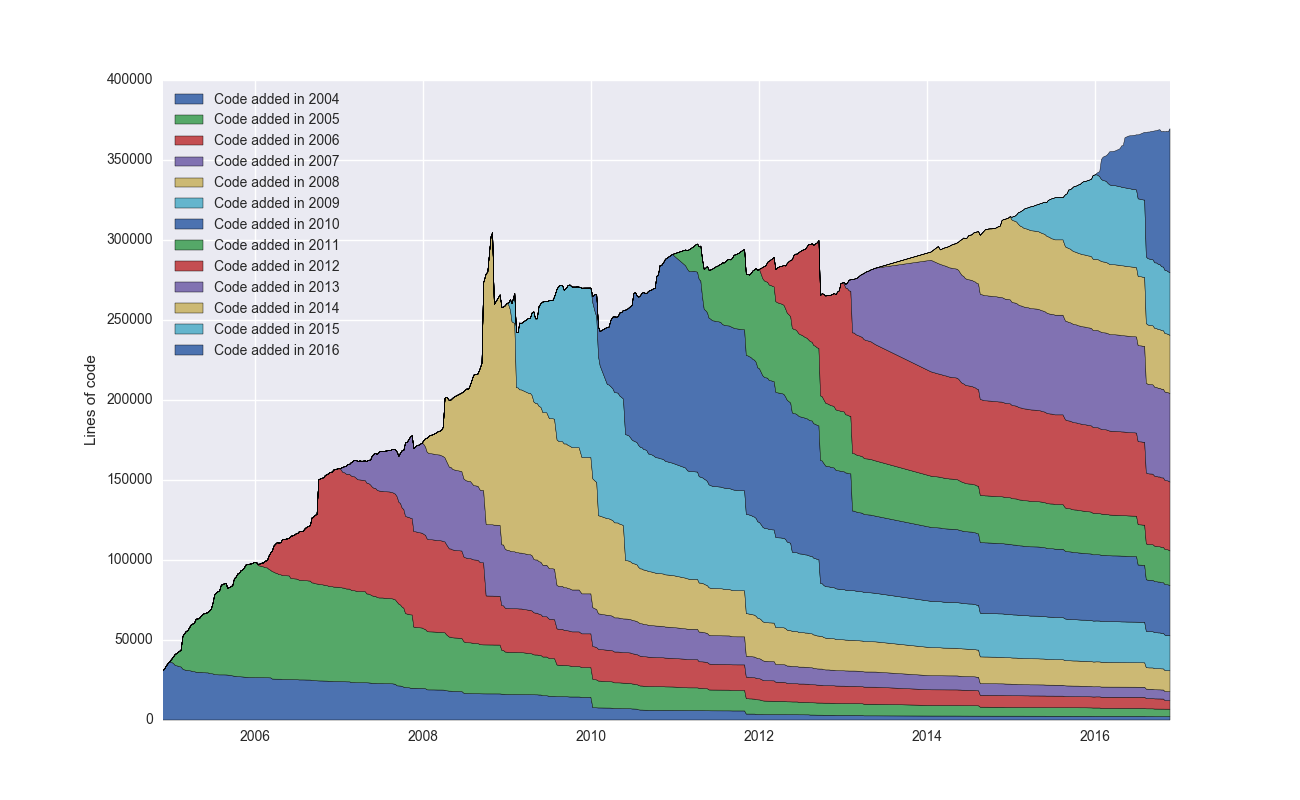
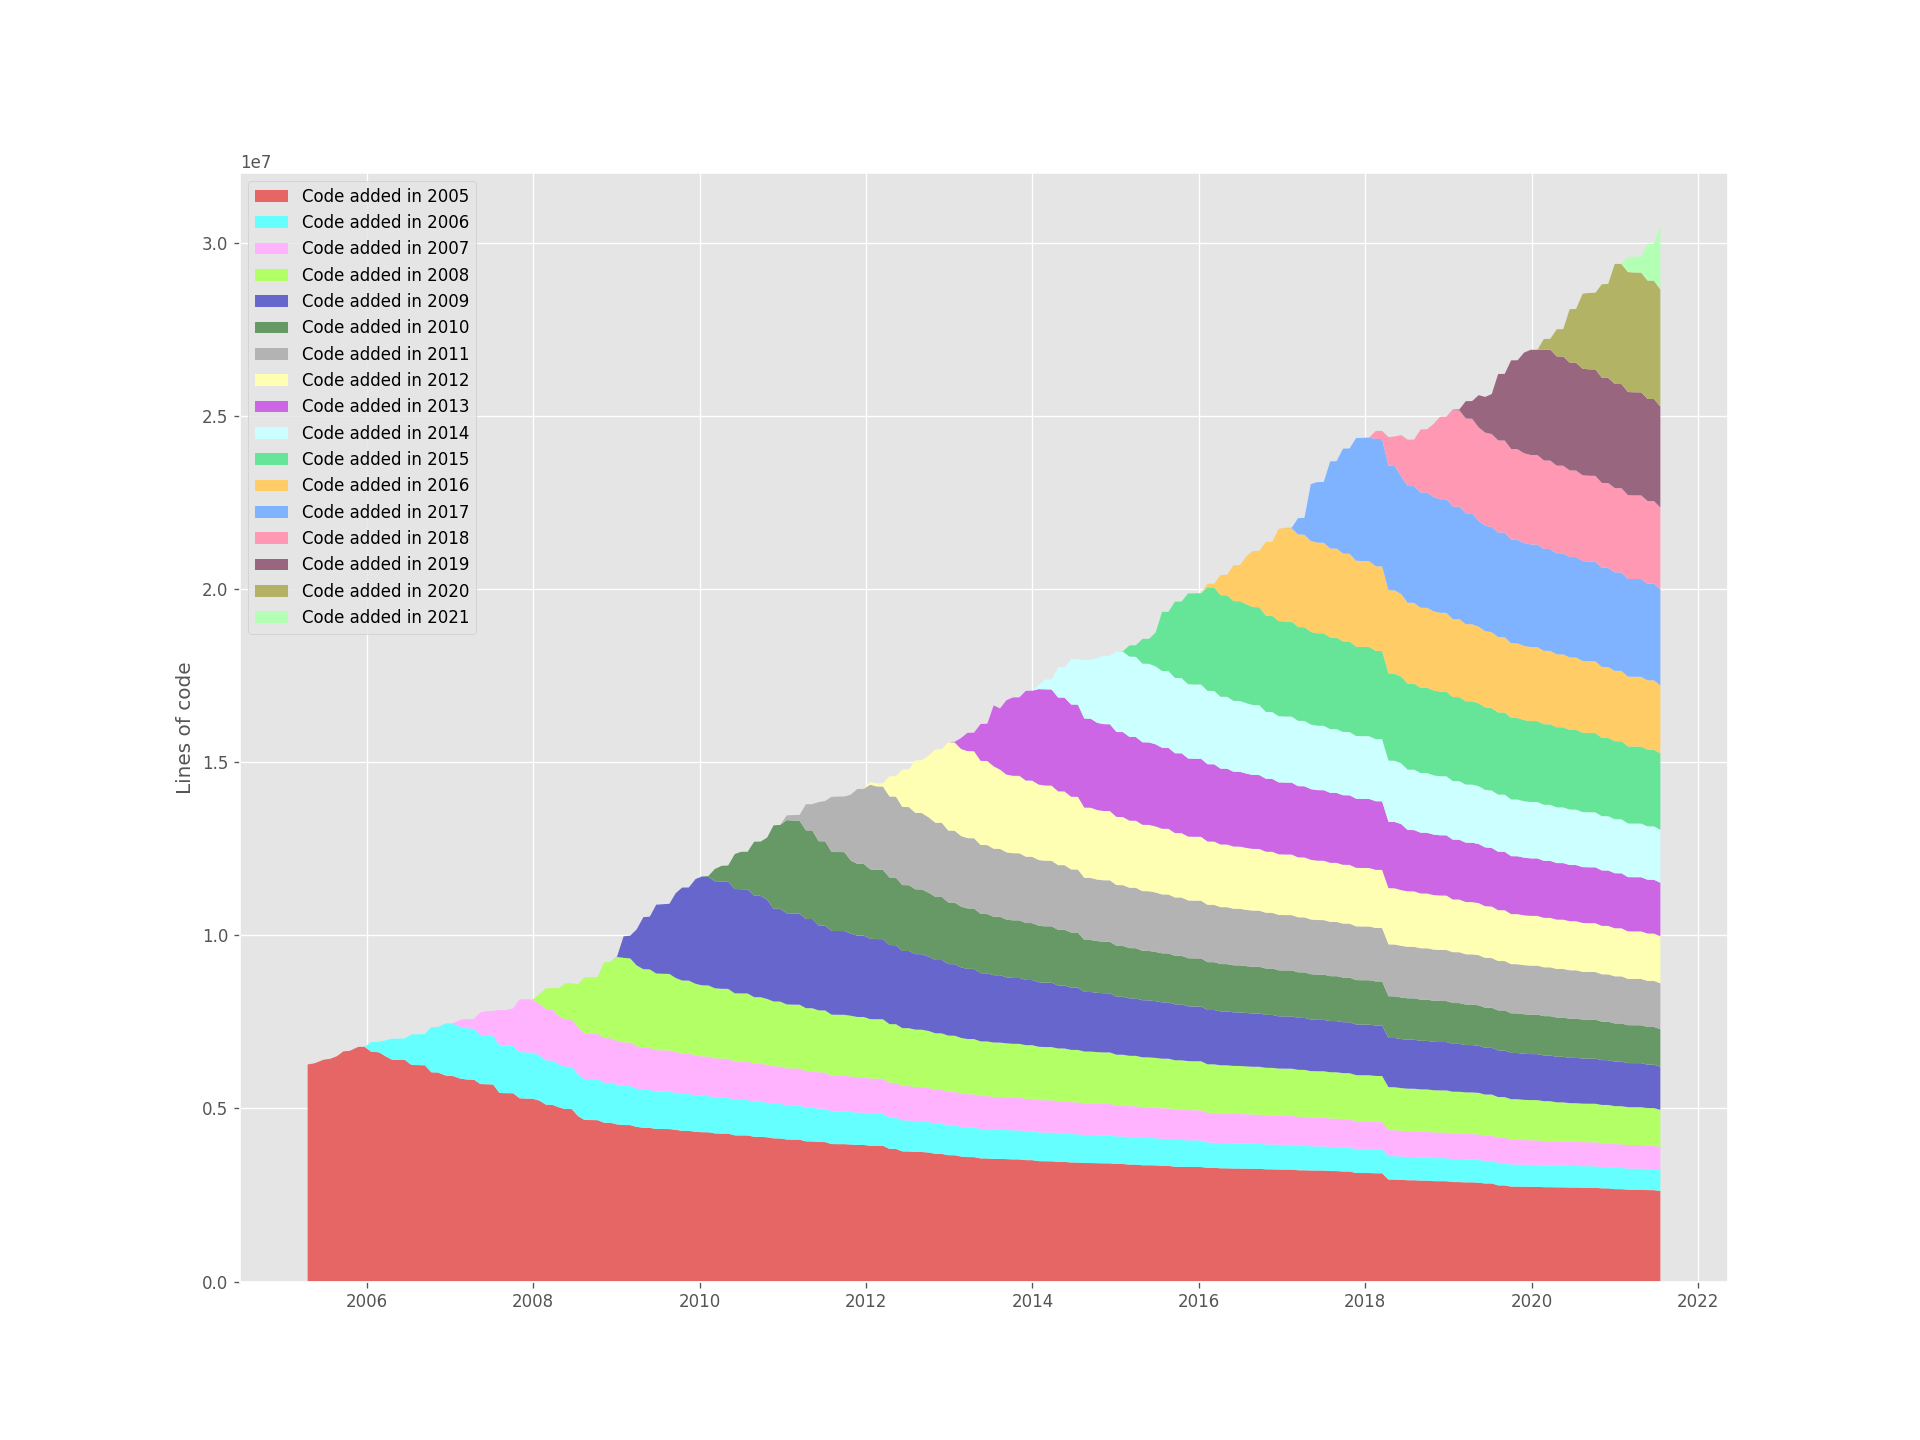
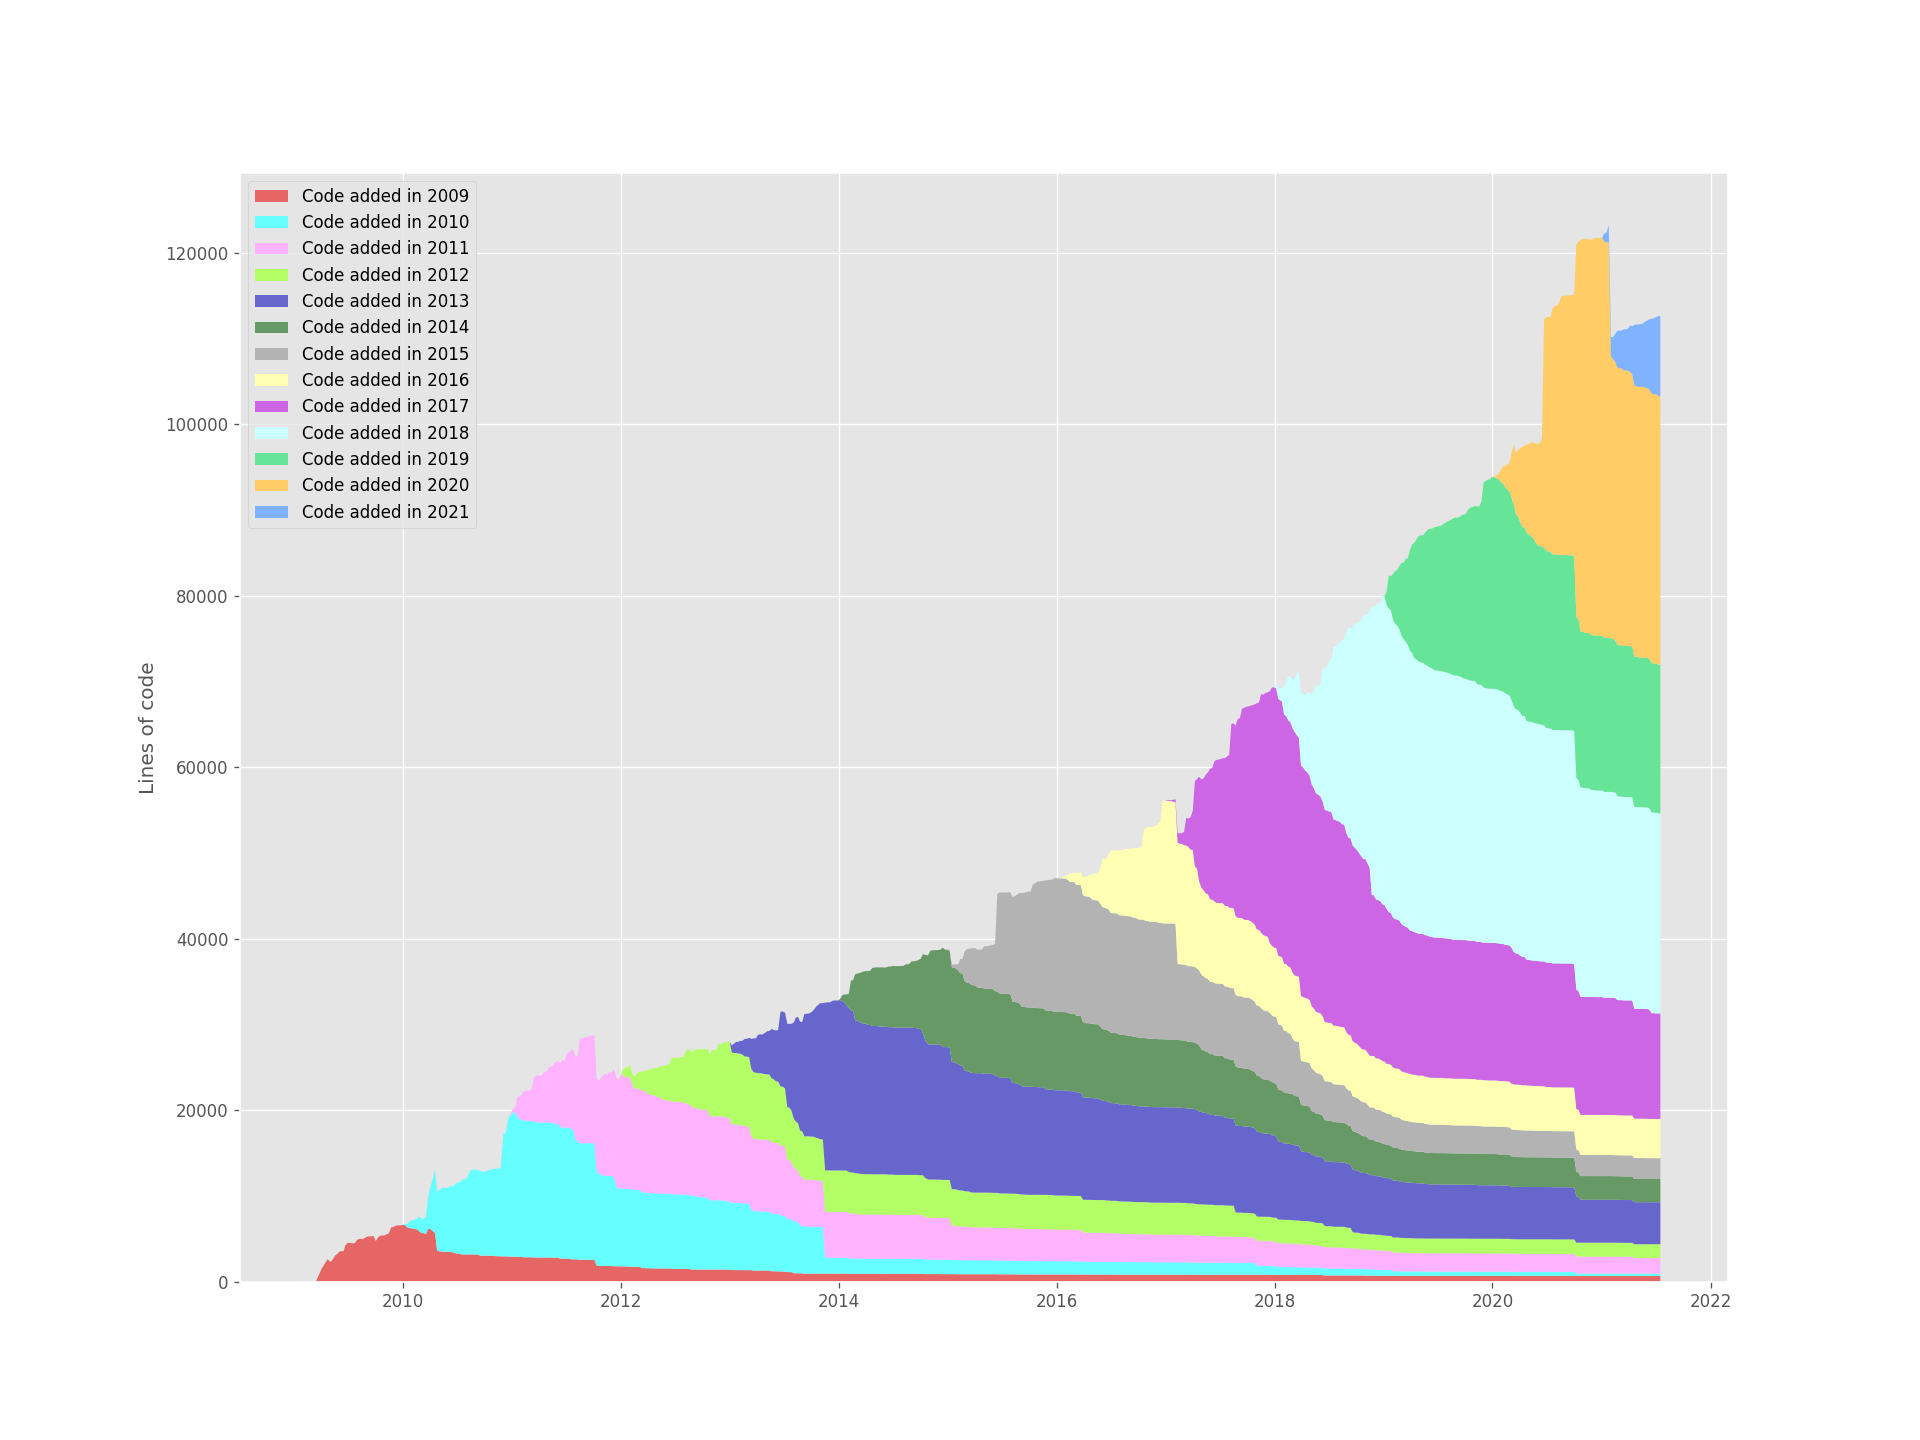
Some scripts to analyze Git repos. Produces cool looking graphs like this (running it on git itself):
- Run
pip install -r requirements.txtto install dependencies - Run
python analyze.py <path to repo>(seepython analyze.py --helpfor a bunch of config) - Run
python stack_plot.py cohorts.jsonwhich will write tostack_plot.png - Run
python survival_plot.py survival.jsonwhich will write tosurvival_plot.png(seepython survival_plot.py --helpfor some options)
If you want to plot multiple repositories, have to run python analyze.py separately for each project and store the data in separate directories using the --outdir flag. Then you can run python survival_plot.py <foo/survival.json> <bar/survival.json> (optionally with the --exp-fit flag to fit an exponential decay)
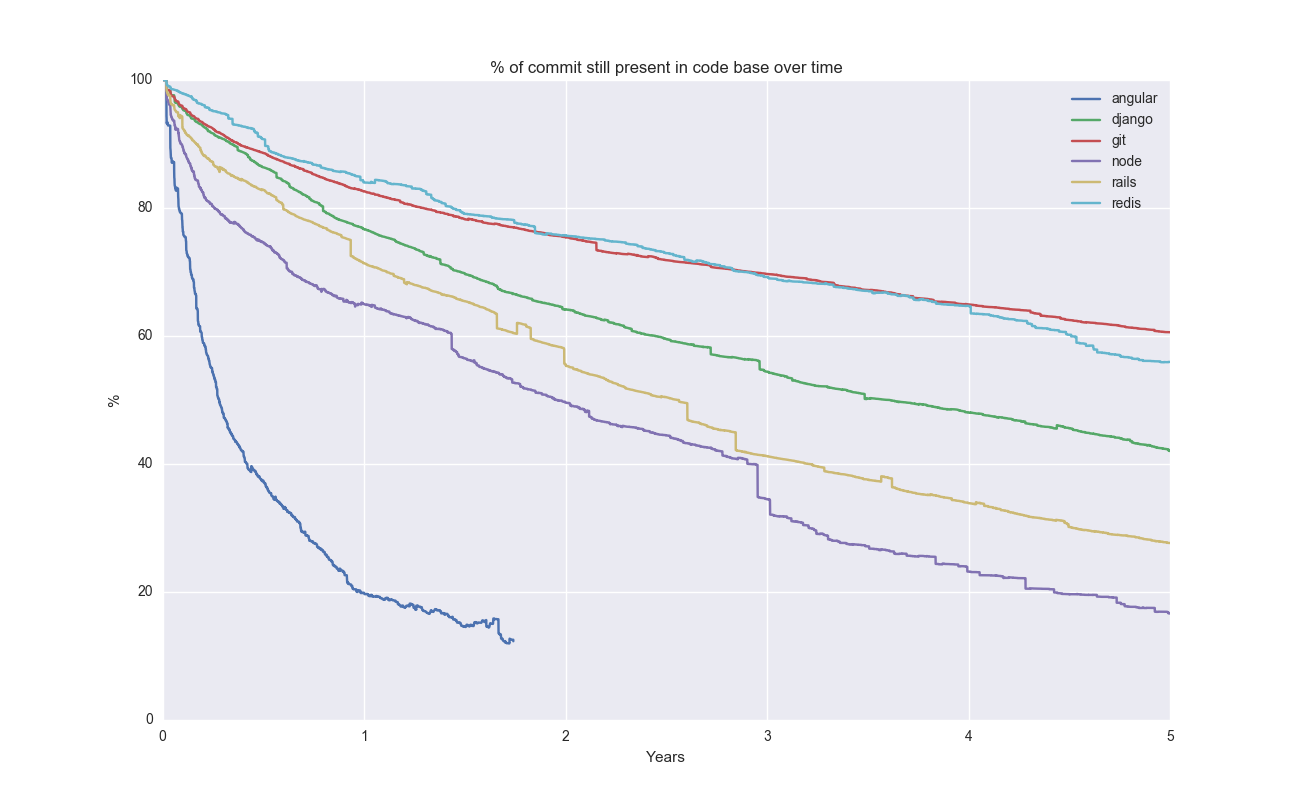
Survival of a line of code in a set of interesting repos:
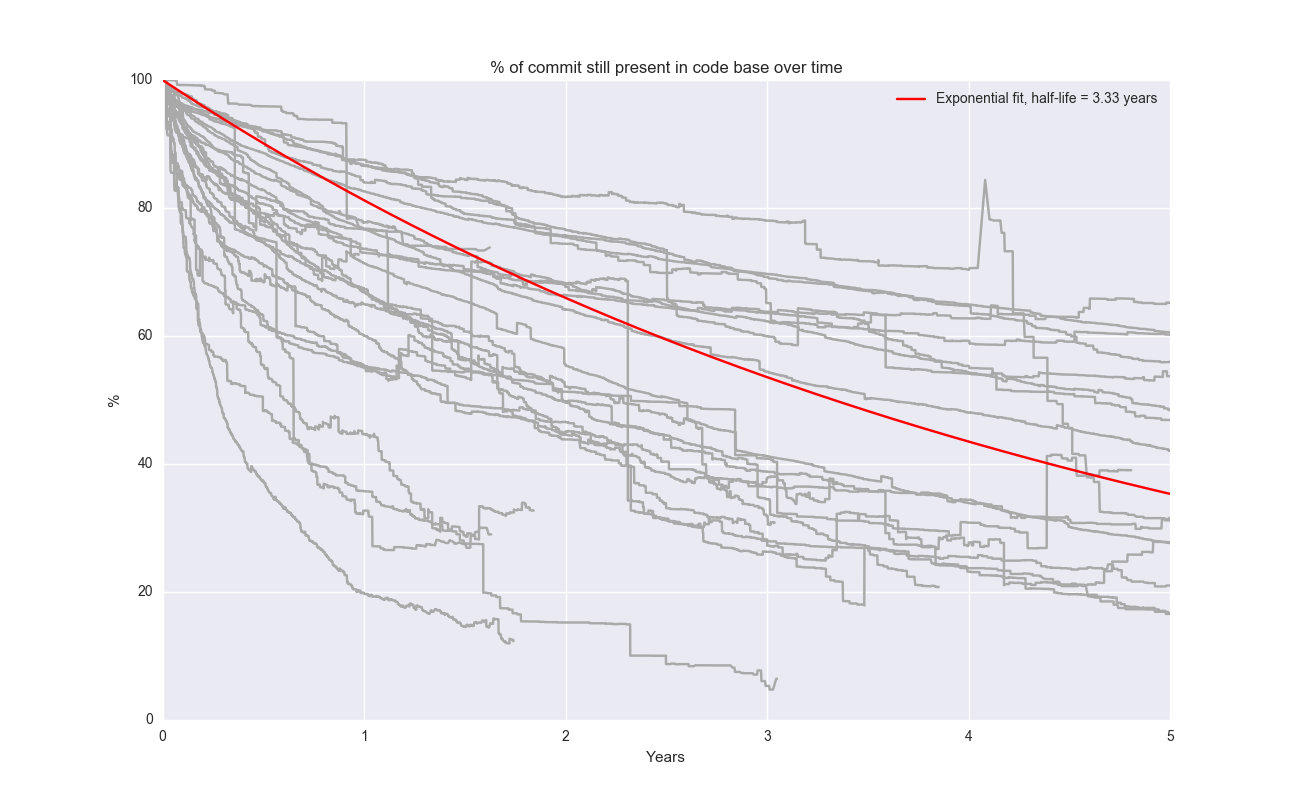
Exponential fit:
Linux:
Node:
Rails: