Lightstep Observability Data Source
The Lightstep Observability Data Source allows you to view and visualize telemetry data from Lightstep Observability directly in Grafana. Using Lightstep as your data source, you can jump directly from a chart in Grafana into Lightstep Observability to find the root cause of an issue, using advanced functionality like Change Intelligence.

Prerequisites
You'll need the following to enable and use the plugin:
-
A Grafana account (version 7 and greater)
NOTE: The plugin only supports graph and time series charts.
-
Telemetry data reporting to Lightstep.
-
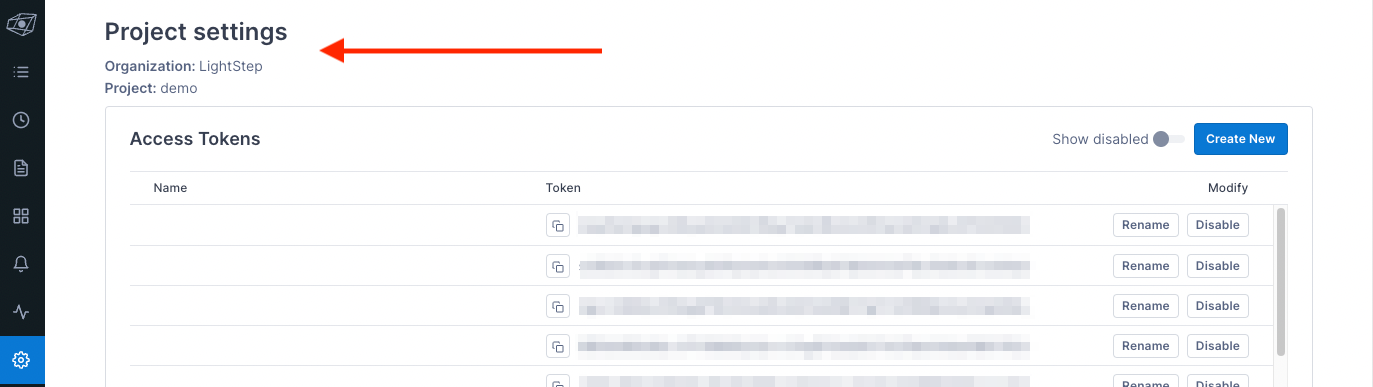
Your Lightstep "Organization" and "Project" name. Both can be found on on the Project Settings page of Lightstep.
-
A Lightstep API key with Viewer permissions created just for Grafana.
Paste the key someplace safe, as you will not be able to access it again from Lightstep.

Installation
Recommended: Install using the Grafana CLI
-
Install the plugin from the Grafana CLI using Grafana's plugin installation instructions. Copy the latest release zip URL from the releases page.
grafana-cli --pluginUrl https://github.com/lightstep/lightstep-observability-datasource/releases/download/v2.0.1/lightstep-observability-datasource-2.0.1.zip \
   plugins install lightstep-observability-datasource
If running locally on Mac OS (arm) via Homebrew, try:
grafana-cli --pluginsDir /opt/homebrew/var/lib/grafana/plugins \ --pluginUrl https://github.com/lightstep/lightstep-observability-datasource/releases/download/v2.0.1/lightstep-observability-datasource-2.0.1.zip \ plugins install lightstep-observability-datasource -
Ensure your Grafana installation is configured to allow unsigned plugins.
This generally requires ensuring the
allow_loading_unsigned_pluginsvalue in thepluginssection ofgrafana.iniis updated to includelightstep-observability-pluginin the list of allowed plugins.[plugins] ;enable_alpha = false ;app_tls_skip_verify_insecure = false # Enter a comma-separated list of plugin identifiers to identify plugins that are allowed to be loaded even if they lack a valid signature. allow_loading_unsigned_plugins = lightstep-observability-datasource
Install directly from GitHub
-
Download the zip file for the plugin.
-
Unzip the release into your Grafana
pluginsdirectory.The value of
YOUR_GRAFANA_PLUGINS_DIRwill depend on your system and how Grafana was installed. For example, it may be at/var/lib/grafana/pluginson Linux.unzip -d [YOUR_GRAFANA_PLUGINS_DIR]/lightstep-observability-datasource lightstep-observability-datasource-X.Y.Z.zip
-
Ensure your Grafana installation is configured to allow unsigned plugins.
This generally requires ensuring the
allow_loading_unsigned_pluginsvalue in thepluginssection ofgrafana.iniis updated to includelightstep-observability-pluginin the list of allowed plugins.[plugins] ;enable_alpha = false ;app_tls_skip_verify_insecure = false # Enter a comma-separated list of plugin identifiers to identify plugins that are allowed to be loaded even if they lack a valid signature. allow_loading_unsigned_plugins = lightstep-observability-datasource
-
In the Grafana plugin installation, install the Lightstep Observability (unsigned) datasource. If you see only the Lightstep Metrics plugin, your installation likely has not succeeded.
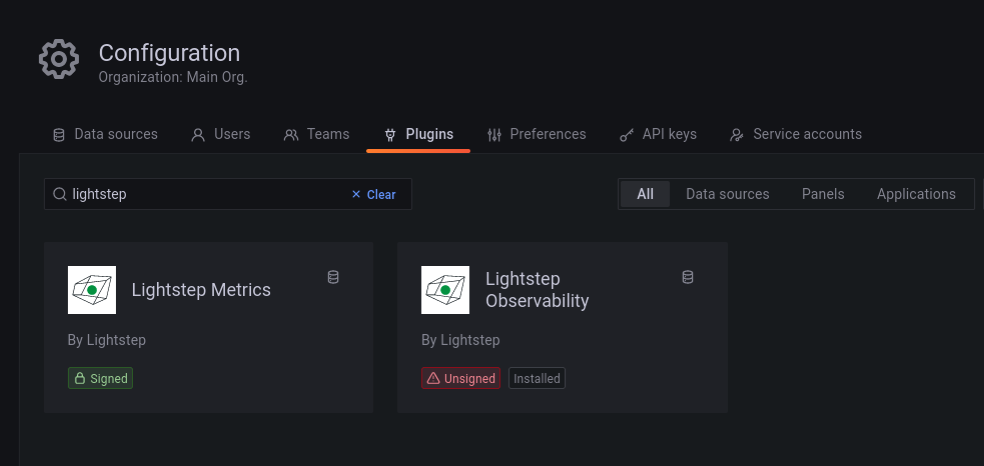

For more information, follow the steps in the Grafana documentation for local installations.
Enable the Lightstep Observability Data Source in Grafana
After you install the plugin, follow these steps. Steps may vary slightly depending on your version of Grafana.
-
Restart the Grafana server so it can discover the new plugin.
-
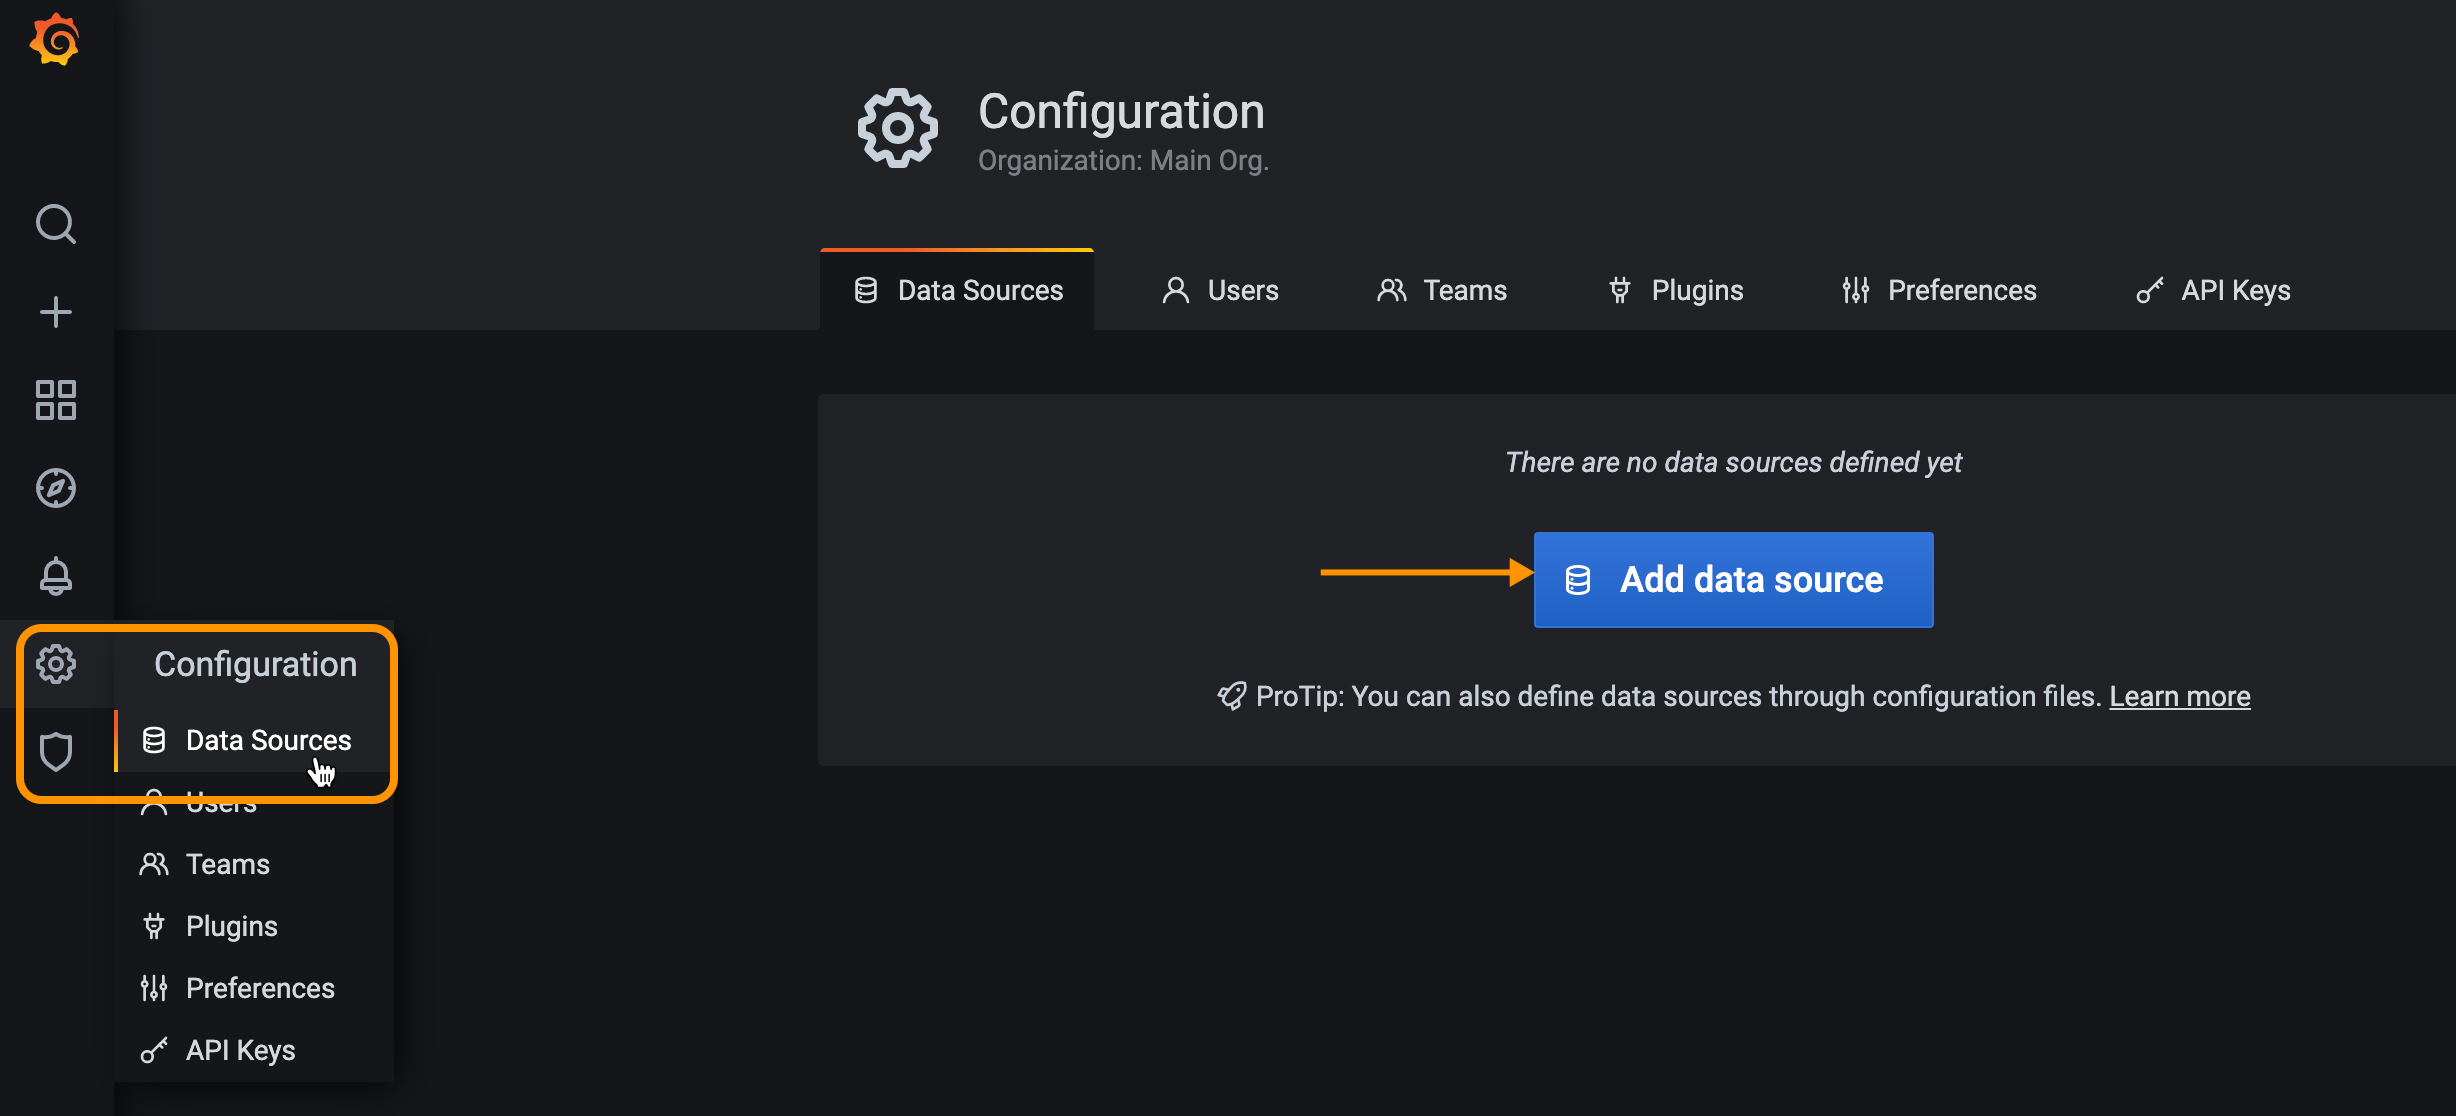
In the Navigation Bar, choose Configuration, select Data Sources, and click Add data source.
-
Start typing
Lightstepin the search field to find the Lightstep Observability data source and click Select. If you do not see the Lightstep plugin listed, please ensure it has been correctly installed or reach out to the Lightstep team for further assistance. -
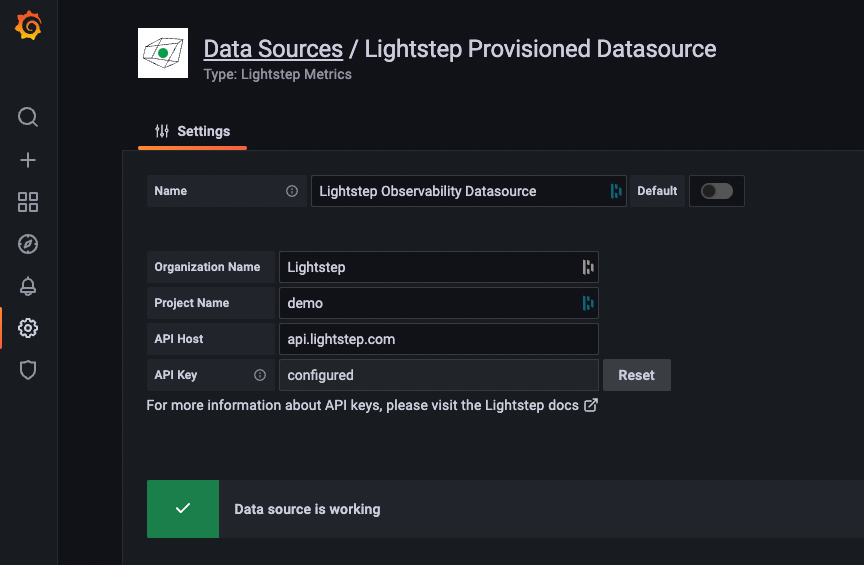
Enter your Lightstep organization and project name. If you want to use the data source with multiple projects, enter the name of each project separated by a comma into the project name field. Then paste in your Lightstep API key and click Save & Test.
Grafana confirms that it's connected to Lightstep.


You can now create dashboards and charts in Grafana using data provided by your Lightstep project.
Create Grafana charts from Lightstep Observability
With the Lightstep plugin installed, you can query your Lightstep data directly from Grafana.
-
From the Query tab of the Edit Panel, select Lightstep Observability data source from the Data source drop down.
-
Add a query to the text input, using the Lightstep's Unified Query Language (UQL).
Click out of the field (or press
shift+Enter) to run your query.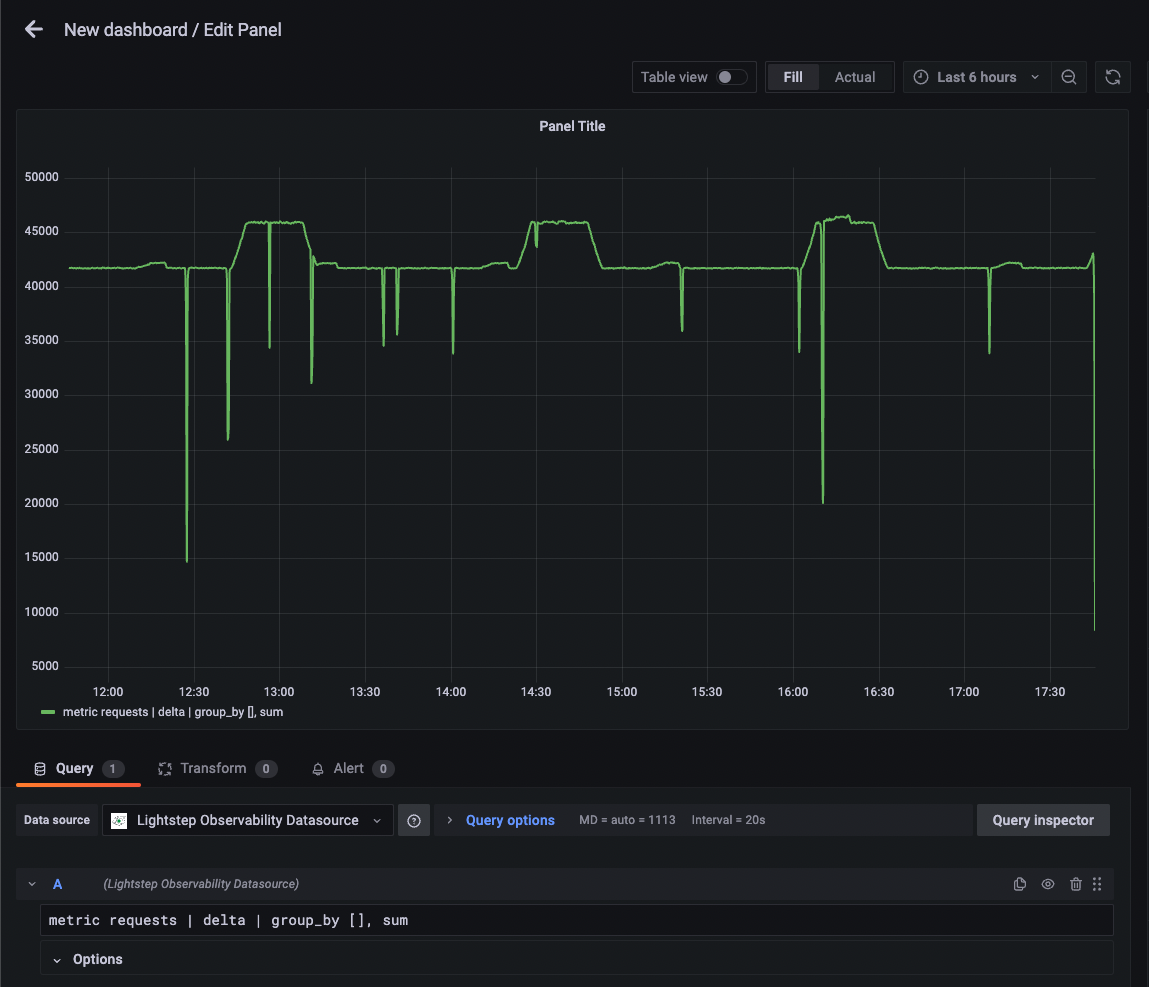
-
Choose the visualization for the chart (Lightstep supports either Graph or Time Series). Click Apply to create the graph.

Investigate a Deviation from a Grafana chart
Now that you have a chart in Grafana, when you notice a unexpected change in your data, you can investigate in Lightstep to rapidly find the root cause.
To investigate, click into the deviation and select Create a Notebook in Lightstep.
You're taken into a Notebook within Lightstep with your query pre-populated, where you can start your investigation.

Utilize Change Intelligence or trace views to further your investigation.

Developing and testing the plugin with Docker
The Makefile in this repository contains a make dev target that builds this plugin and uses docker-compose to run a new instance of Grafana for development and testing.
When running, the local development instance of Grafana should be available at localhost:3000.
- As with most Grafana Docker images, the default login/password is
admin/admin. - Setup the datasource by going to Settings > Data sources and then searching for "Lightstep"
- Set the Org name, Project name, API host, and API key (based on your Lightstep account). Save & test the configuration.
- Create a new dashboard with a new Panel, select Lightstep Observability as the data source and enter a query.
Note: The docker-compose.yml includes a grafana-storage volume to persist settings across launches, so configuration is necessary only on the first run.