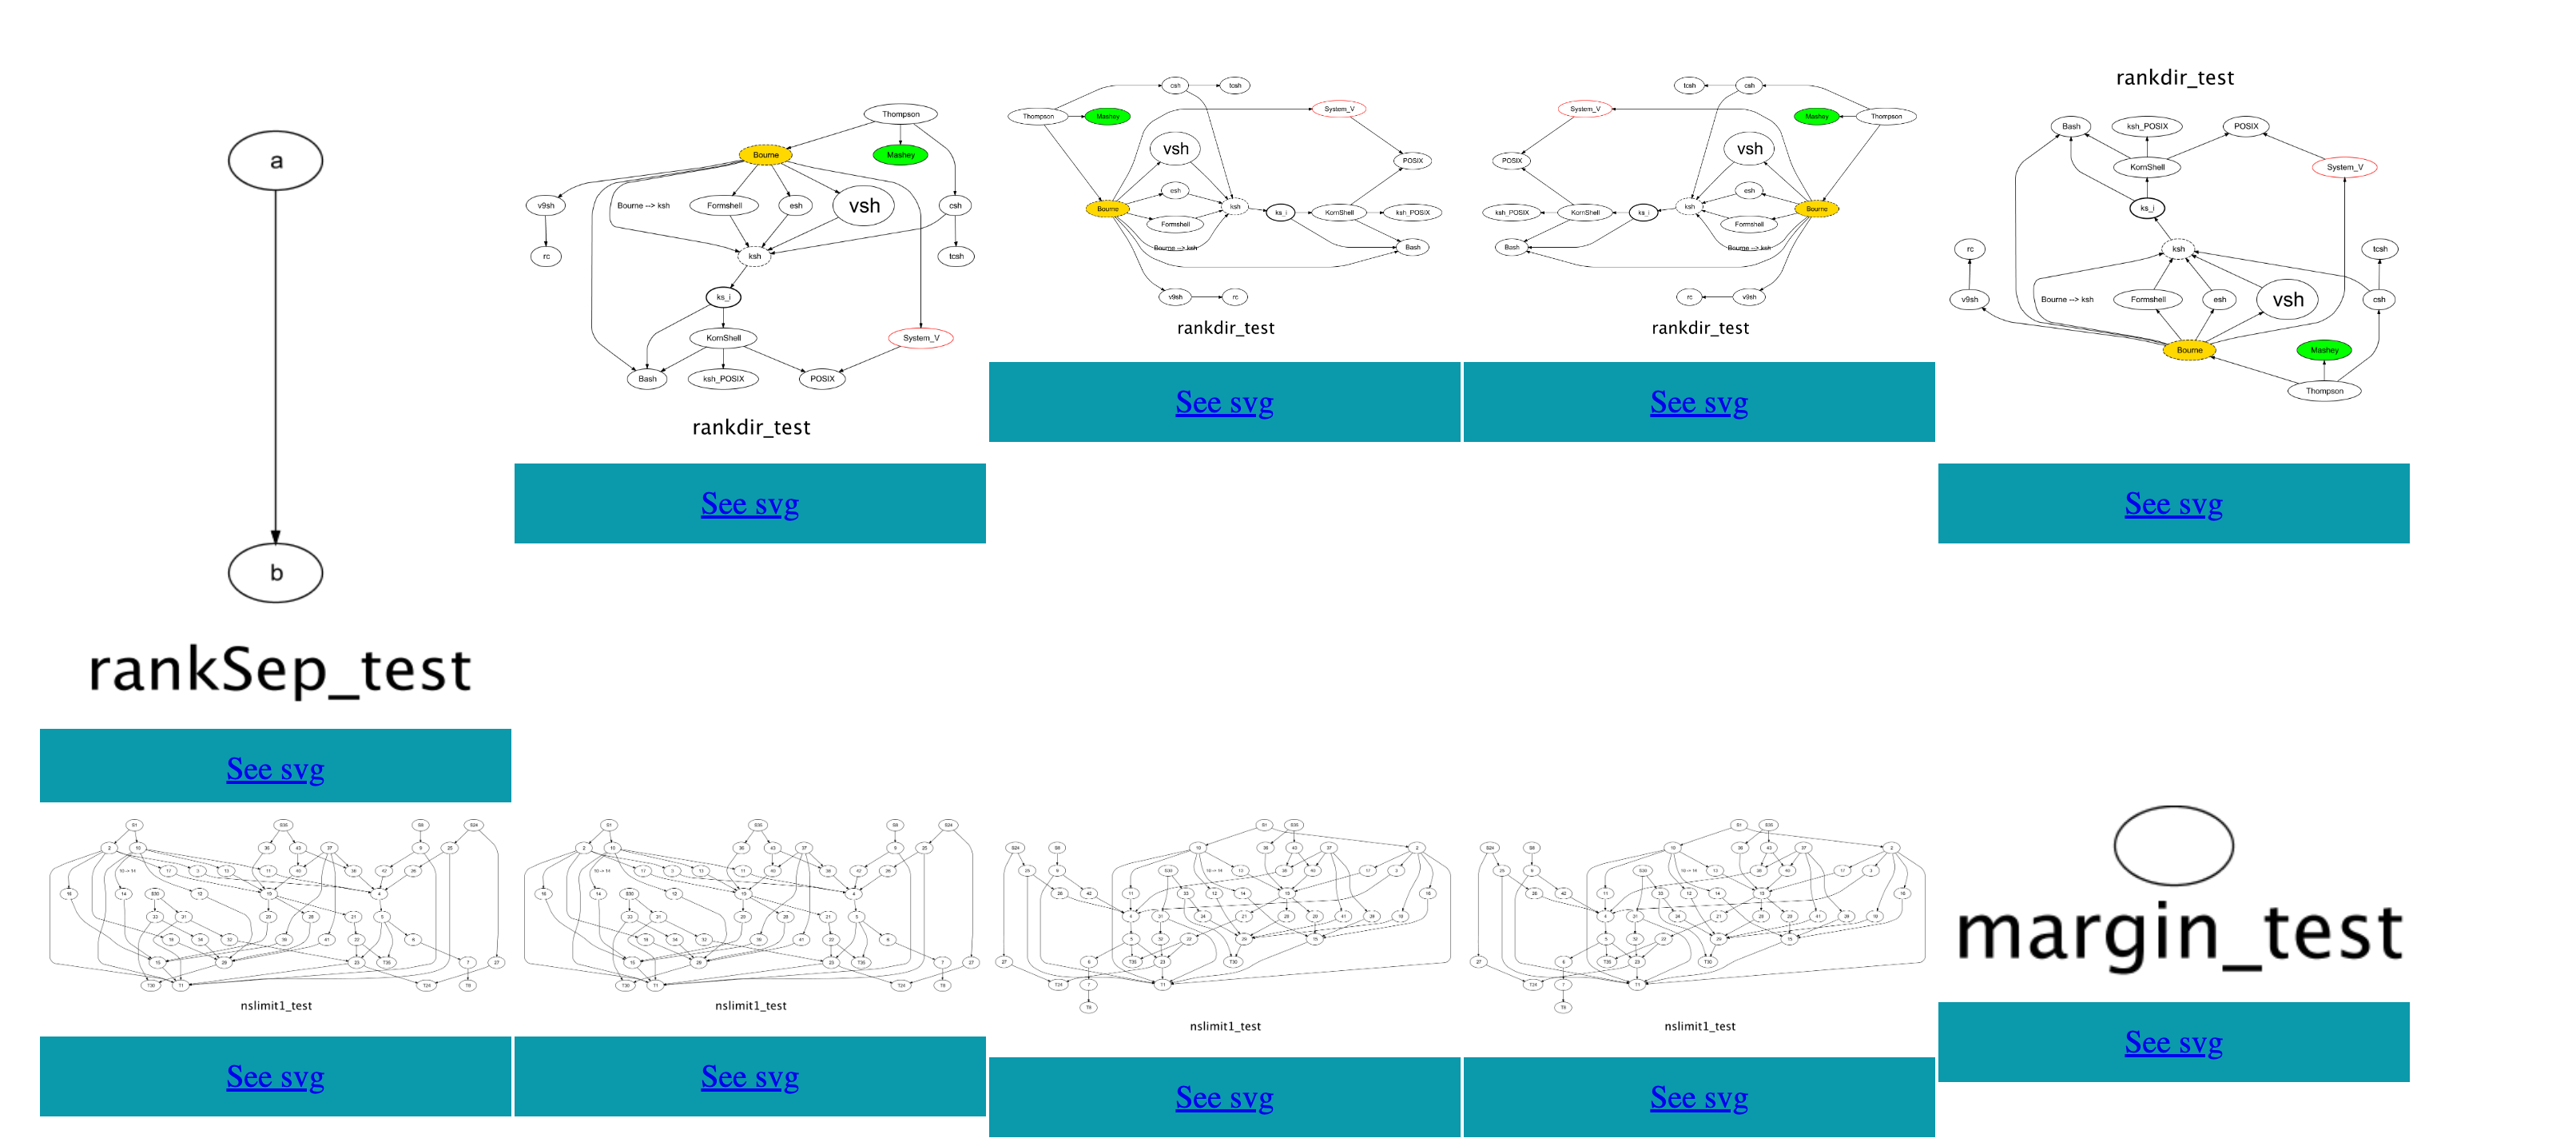
graph-support
graph-support is a minimalistic re-implementation of a Graphviz using pure Java, almost without external dependencies. It is designed to be small and efficient, and provides a Java API similar to dot-script.
Key Features:
-
API like Dot-script structure
-
No external dependencies
-
Lightweight and efficient
Target Audience:
Developers who need to work with Graphviz in their Java applications, but want a small and efficient solution without relying on external libraries.
How to build
You require the following to build graph-support:
- Latest stable OpenJDK 8
- Latest stable Apache Maven
Run the following command under the current project:
mvn clean installAfter building, go to target/test-classes/visual/graph-visual.html to see all the visual test cases.
Usage
Import
This project is available via Maven:
<dependency>
    <groupId>org.graphper</groupId>
    <artifactId>graph-support</artifactId>
    <version>1.3.0</version>
</dependency>
API like Dot-script
An API with a structure like a dot script, if you have written dot, it is easy to think of how to convert it into the corresponding java code:
digraph Q {
  // Node attribute template
  node [shape=rect];

  // Node definition
  nd_1   [label = "Node 1"];
  nd_2   [label = "Node 2"];
  nd_3_a [label = "Above Right Node 3"];
  nd_3_l [label = "Left of Node 3"];
  nd_3   [label = "Node 3"];
  nd_3_r [label = "Right of Node 3"];
  nd_4   [label = "Node 4"];

  // Edges in root graph
  nd_3_a -> nd_3_r;
  nd_1 -> nd_2 -> nd_3 -> nd_4;

  // Use Cluster to wrap the corresponding nodes and edges
  subgraph cluster_R {
    // Edge attribute template
    edge[color=grey arrowhead=none]
    // Use Subgraph to limit nodes to the same level
    {
        rank=same
        nd_3_l
        nd_3
        nd_3_r
    }

    // Edges in cluster
    nd_3_l -> nd_3 -> nd_3_r;
  }
}
The Java code of a similar structure is as follows:
// Node definition
Node nd_1 = Node.builder().label("Node 1").build();
Node nd_2 = Node.builder().label("Node 2").build();
Node nd_3_a = Node.builder().label("Above Right Node 3").build();
Node nd_3_l = Node.builder().label("Left of Node 3").build();
Node nd_3 = Node.builder().label("Node 3").build();
Node nd_3_r = Node.builder().label("Right of Node 3").build();
Node nd_4 = Node.builder().label("Node 4").build();

Graphviz graphviz = Graphviz.digraph()
    // Node attribute template
    .tempNode(Node.builder().shape(NodeShapeEnum.RECT).build())
    // Edges in root graph
    .addLine(nd_3_a, nd_3_r)
    .addLine(nd_1, nd_2, nd_3, nd_4)
    // Use Cluster to wrap the corresponding nodes and edges
    .cluster(
        Cluster.builder()
            // Edge attribute template
            .tempLine(Line.tempLine().color(Color.GREY).arrowHead(ArrowShape.NONE).build())
            // Use Subgraph to limit nodes to the same level
            .subgraph(
                Subgraph.builder()
                    .rank(Rank.SAME)
                    .addNode(nd_3_l, nd_3, nd_3_r)
                    .build()
            )
            // Edges in cluster
            .addLine(nd_3_l, nd_3, nd_3_r)
            .build()
    )
    .build();

// Print svg
System.out.println(graphviz.toSvgStr());
// Save png
graphviz.toFile(FileType.PNG).save("./", "example");
Multi output file type (>= 1.2.0)
graph-support support multi output formats if version >= 1.2.0 (only support svg before 1.2.0):
| svg | png | jpg | jpeg | gif | tiff | ||
|---|---|---|---|---|---|---|---|
| JDK (>=1.8) | Y | Y | Y | Y | Y | N | N |
| Android 13 (API level 33) Only test >= 13 |
Y | Y | N | Y | N | N | N |
| JDK (>=1.8) + batik(>=1.9) | Y | Y | Y | Y | Y | Y | N |
| JDK(>=1.8) + batik(>=1.9) + fop(>=2.4) | Y | Y | Y | Y | Y | Y | Y |
Note: The version for the Android platform is only a recommendation, because versions below 13 have not been tested, it does not means other version won't work
Quickly expand output formats
graph-support detect environments when need render specific file type and throws FailInitResourceException if do not have any ways to rendering, so we just need import dependencies without any extra coding:
// Output PNG only relys on java.awt and android.graphics
graphviz.toFile(FileType.PNG);

// Output TIFF without batik will throws FailInitResourceException
graphviz.toFile(FileType.TIFF);

// Output PDF without fop will throws FailInitResourceException
graphviz.toFile(FileType.PDF);
import batik dependencies via maven
<dependency>
    <groupId>org.apache.xmlgraphics</groupId>
    <artifactId>batik-codec</artifactId>
    <version>1.9</version>
</dependency>
<dependency>
    <groupId>org.apache.xmlgraphics</groupId>
    <artifactId>batik-transcoder</artifactId>
    <version>1.9</version>
</dependency>
no need change code
// Output PNG only relys on java.awt and android.graphics
graphviz.toFile(FileType.PNG);

// Output TIFF success because have batik in runtime
graphviz.toFile(FileType.TIFF);

// Output PDF without FOP will throws FailInitResourceException
graphviz.toFile(FileType.PDF);
import fop dependencies via maven
<dependency>
    <groupId>org.apache.xmlgraphics</groupId>
    <artifactId>batik-codec</artifactId>
    <version>1.9</version>
</dependency>
<dependency>
    <groupId>org.apache.xmlgraphics</groupId>
    <artifactId>batik-transcoder</artifactId>
    <version>1.9</version>
</dependency>
<dependency>
    <groupId>org.apache.xmlgraphics</groupId>
    <artifactId>fop</artifactId>
    <version>2.4</version>
</dependency>
same code as above
// Output PNG only relys on java.awt and android.graphics
graphviz.toFile(FileType.PNG);

// Output TIFF success because have batik in runtime
graphviz.toFile(FileType.TIFF);

// Output PDF success because have fop in runtime
graphviz.toFile(FileType.PDF);
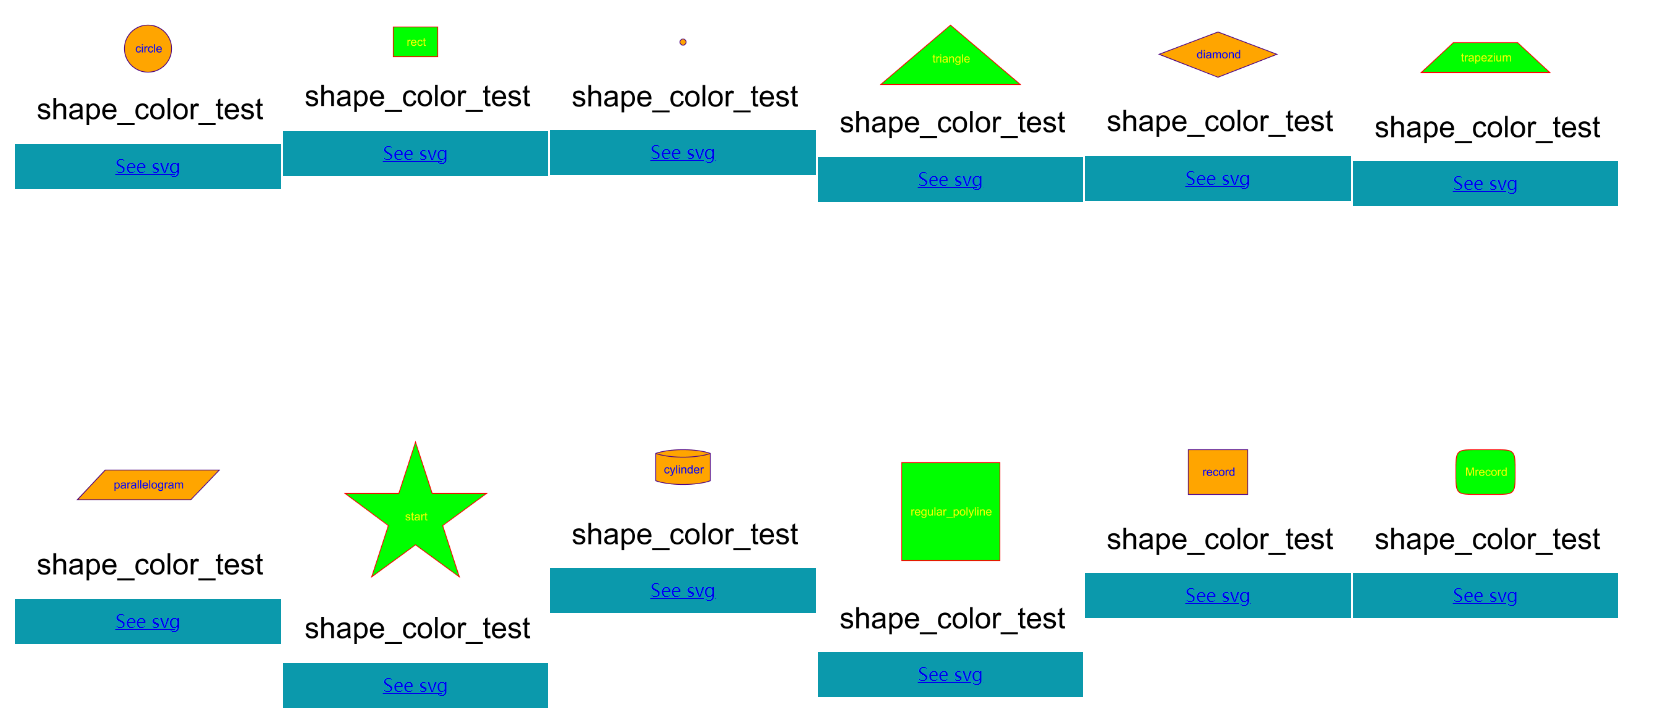
Node shape example
Record node example
Node a = Node.builder().label("{{Name|Sex|Age}|{Michael|Men|15}|{Abigail|Female|18}}")
    .margin(0.5)
    .build();
Node b = Node.builder().label(
    "{{1|2|3}|{4|5|6}|{7|8|{{22|22|33}|{44|55|66}|{77|88|{{1010|2020}|{3030|40404040}}}}}}")
    .build();
Node c = Node.builder().label(
    "{First Cell Row1\nFirst Cell Row2\nFirst Cell Row3|Third Cell}|{Second Cell|Fourth Cell}")
    .build();
Node d = Node.builder().label(
    "{{First|Second|Third}|{|||}|{3Line: First|3Line: Second|3Line:Third}|{|||{{o|x|o}|{x|o|x}|{o|x|o}}}}")
    .build();

Graphviz graphviz = Graphviz.digraph()
    .label("Node Record Cases")
    .tempNode(
        Node.builder()
        .shape(NodeShapeEnum.RECORD)
        .color(Color.PURPLE)
        .fontColor(Color.BLUE)
        .style(NodeStyle.BOLD)
        .build()
	)
    .addNode(a, b, c, d)
    .build();
Table and Assemble
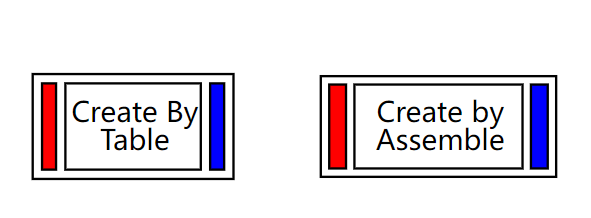
Table provides the html table layout of Cells, and Assemble is an original way of splicing Cells. Here is an example of drawing the same graph using both methods:
    Node table = Node.builder()
        .table(
            table().cellSpacing(4)
                .tr(
                    td().bgColor(Color.RED),
                    td().text("Create By\nTable"),
                    td().bgColor(Color.BLUE)
                )
        )
        .build();

    Node assemble = Node.builder()
        .assemble(
            Assemble.builder()
                .width(1.6)
                .height(0.6)
        		// Left Cell
                .addCell(0.05, 0.05,// Offset
                         Node.builder()
                             .width(0.1)
                             .height(0.5)
                             .fillColor(Color.RED)
                             .build())
        		// Middle cell
                .addCell(0.2, 0.05,// Offset
                         Node.builder()
                             .width(1)
                             .height(0.5)
                             .fontSize(12)
                             .label("Create by \nAssemble")
                             .build())
        		// Right cell
                .addCell(1.25, 0.05,// Offset
                         Node.builder()
                             .width(0.1)
                             .height(0.5)
                             .fillColor(Color.BLUE)
                             .build())
                .addCell(0, 0,
                         Node.builder()
                             .width(1.4)
                             .height(0.6)
                             .build())
                .build()
        )
        .build();

    Graphviz.digraph()
        .tempNode(Node.builder().shape(NodeShapeEnum.PLAIN).build())
        .addNode(table, assemble)
        .build();
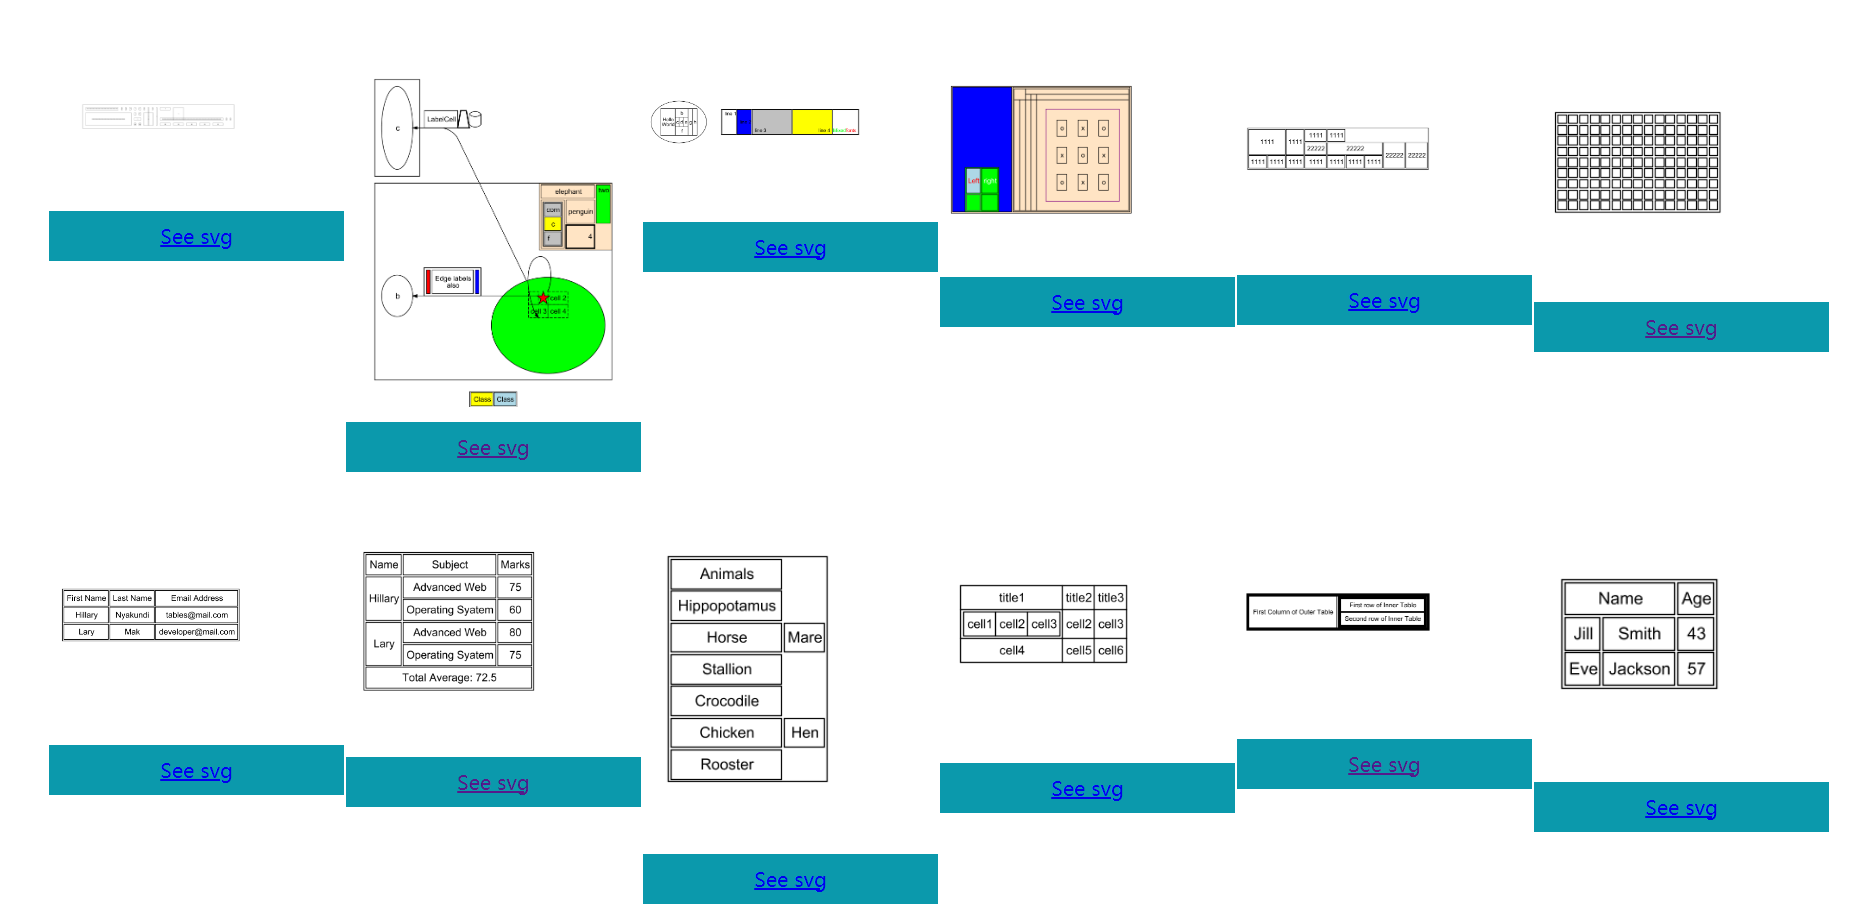
Some table example:
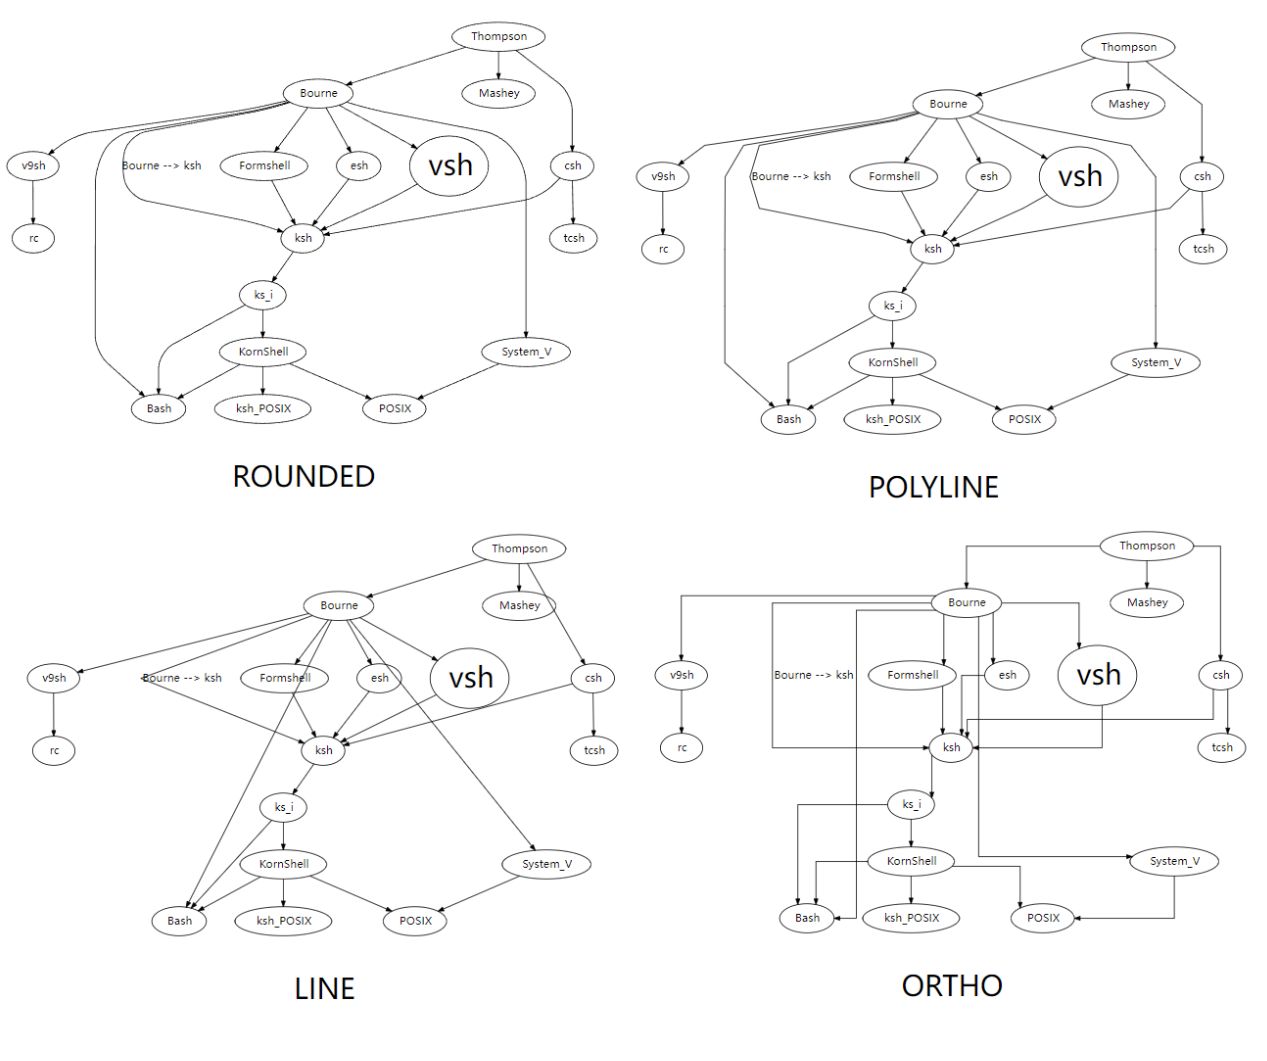
Edge router example
Edge router debug attribute
Some properties can be used to debug edge router:
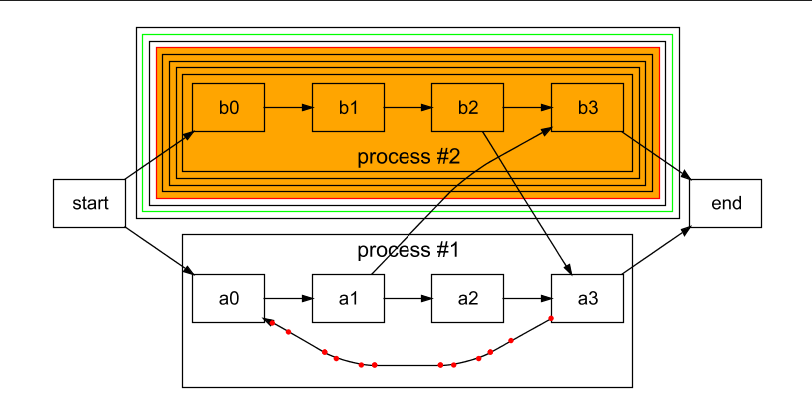
Show control points
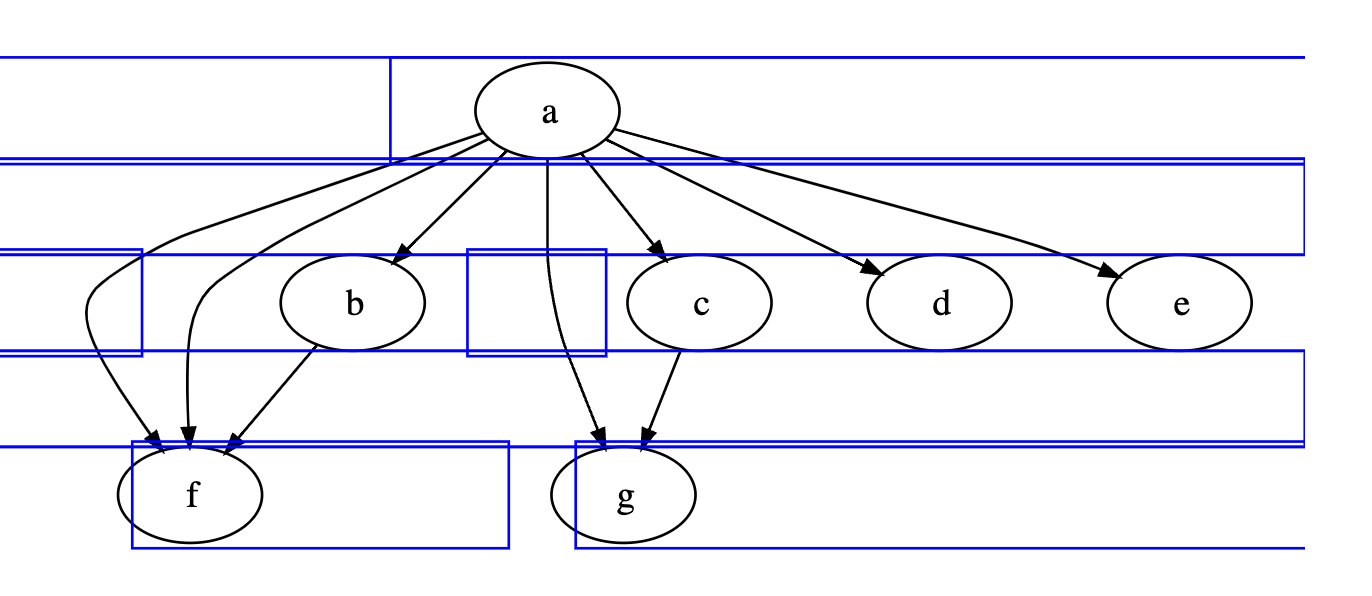
Show edge router boxes
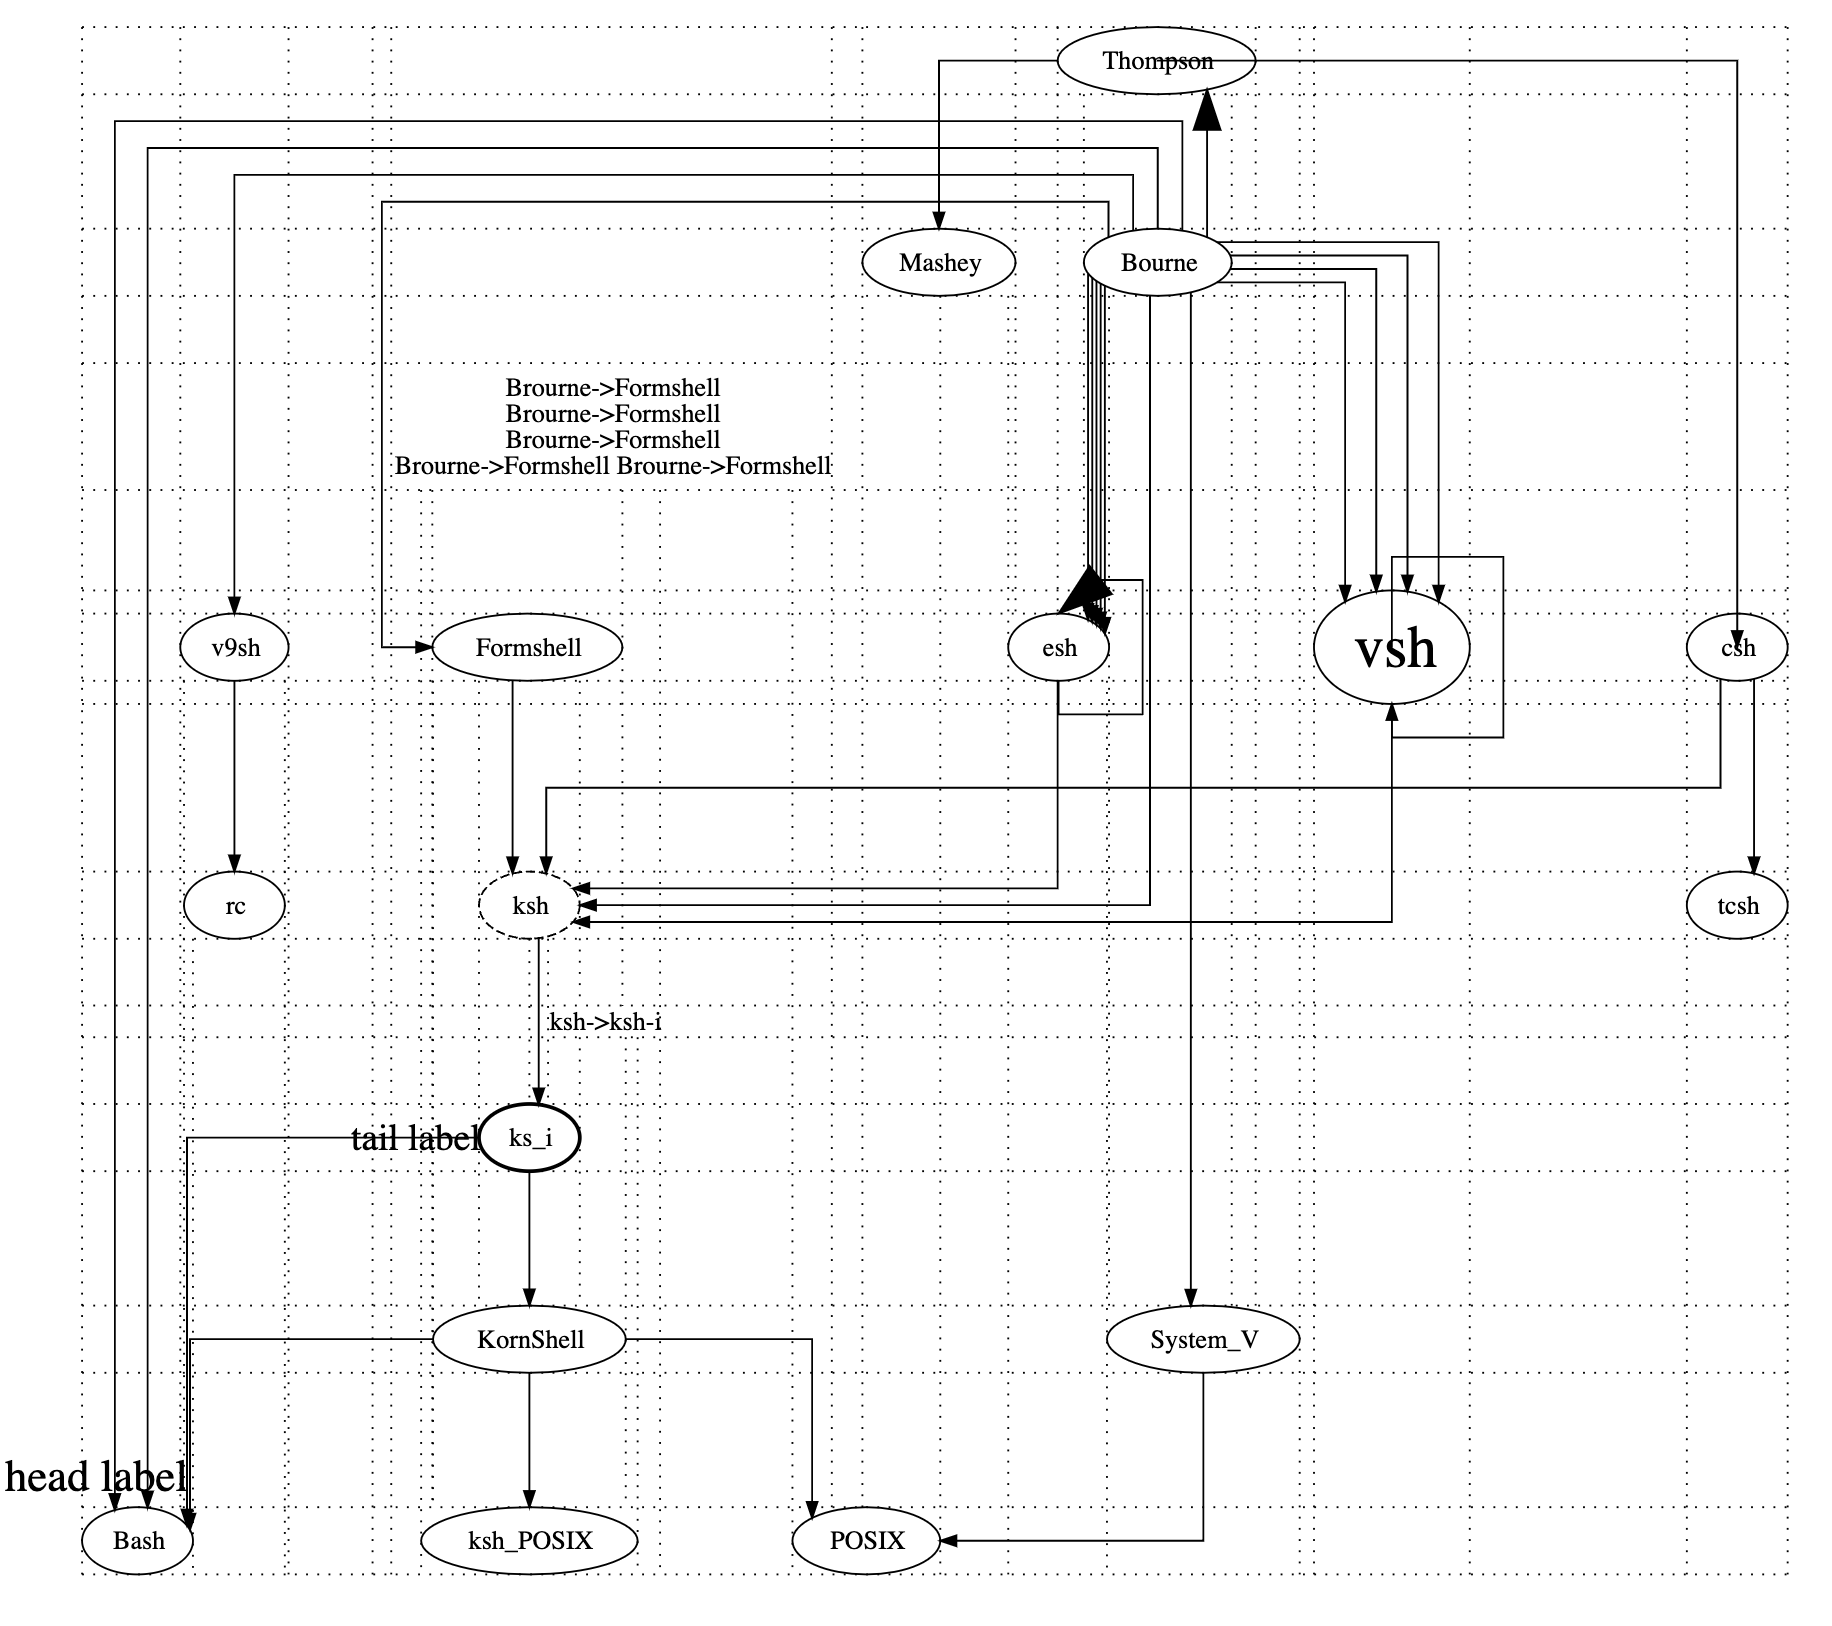
Show grid in ORTHO
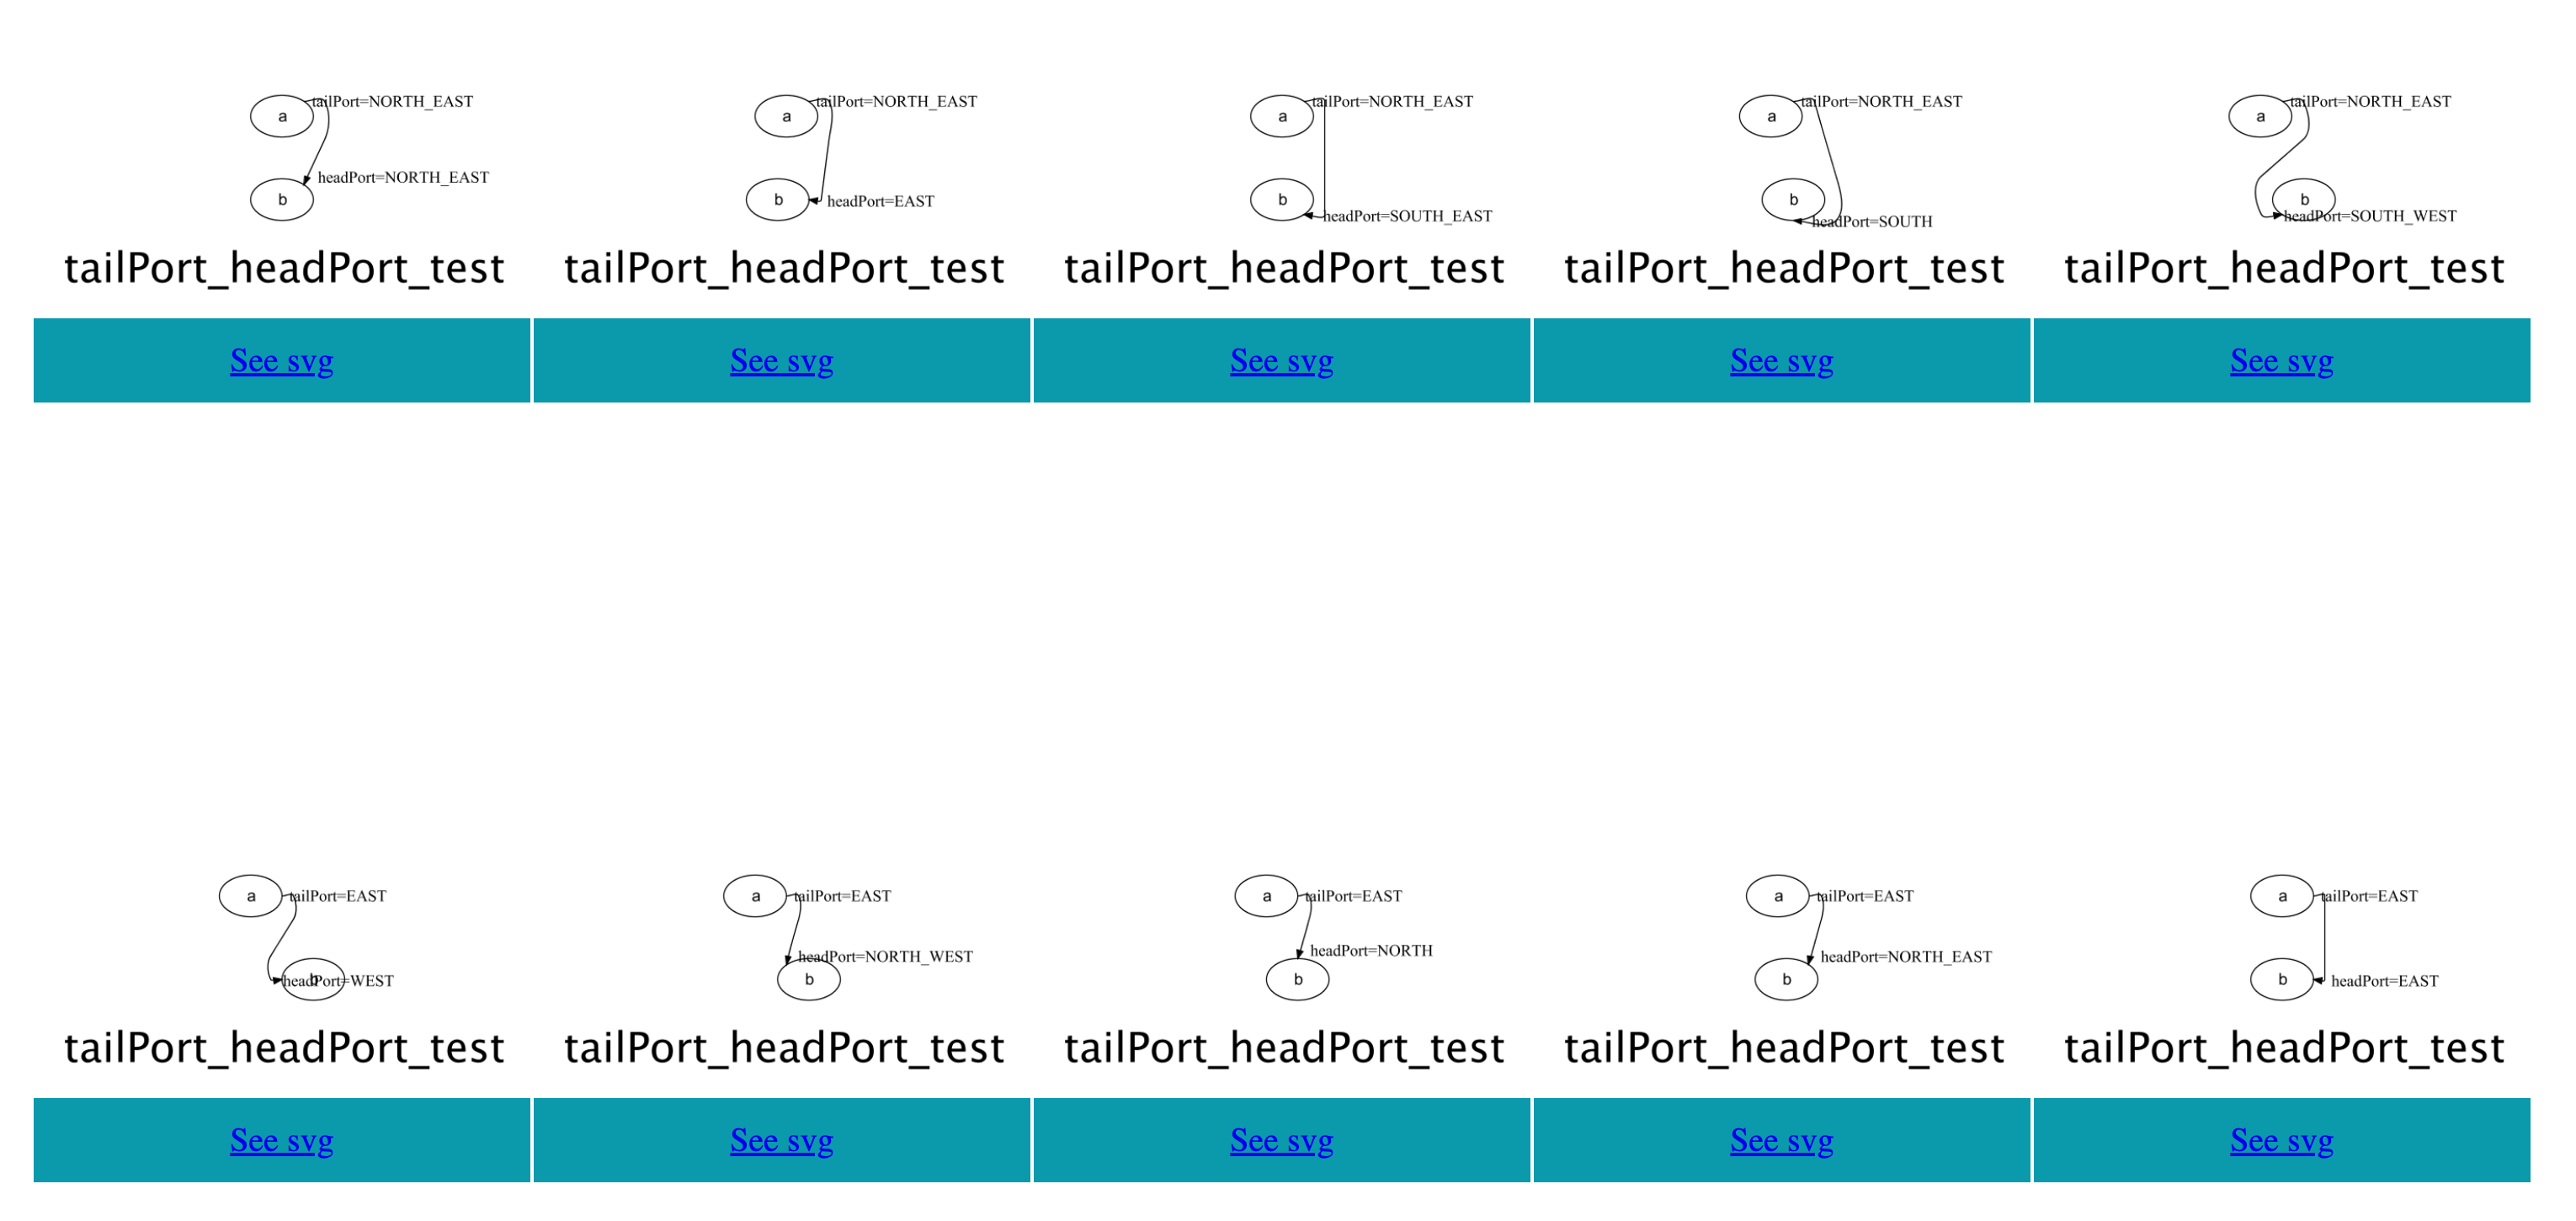
Edge Port
Use layout engine
If you only want to use the layout engine to calculate the coordinates of nodes and the position of line segments, the following is a simple example:
Node a = Node.builder().label("a").build();
Node b = Node.builder().label("b").build();
Graphviz graphviz = Graphviz.digraph()
    .addLine(a, b)
    .build();

// Use the layout engine directly, skip graph rendering
DrawGraph drawGraph = Layout.DOT.getLayoutEngine().layout(graphviz);

for (NodeDrawProp node : drawGraph.nodes()) {
  // The node coordinate
  double x = node.getX();
  double y = node.getX();

  // Set the coordinates into your own program
}

for (LineDrawProp line : drawGraph.lines()) {
  // all points of the line segment
  for (FlatPoint point : line) {
    // If the line is a curve, every group of four points forms a two-stage Bezier curve,
    // and every two adjacent Bezier curves share one point
    if (line.isBesselCurve()) {
    } else {
    }
  }
}
Contributing
We welcome all developers to contribute to the project. If you're interested in contributing code, here are some areas where we'd love to do more work:
- Add more node and arrow shapes to the library;
- Implement basic styling for additional elements in the graph;
- Build a dot script parser that maps to the graph-support API;
- Create new line routing or node layout algorithms to enhance the library.
Please feel free to contribute in any way you feel comfortable, and thank you for your interest in our project!
