Simple web serwer that gets output from Stellaris map generation scripts and turns them into charts using Three.js 3d lib.
npm i
node server.js
# GOTO: http://localhost:3690/test
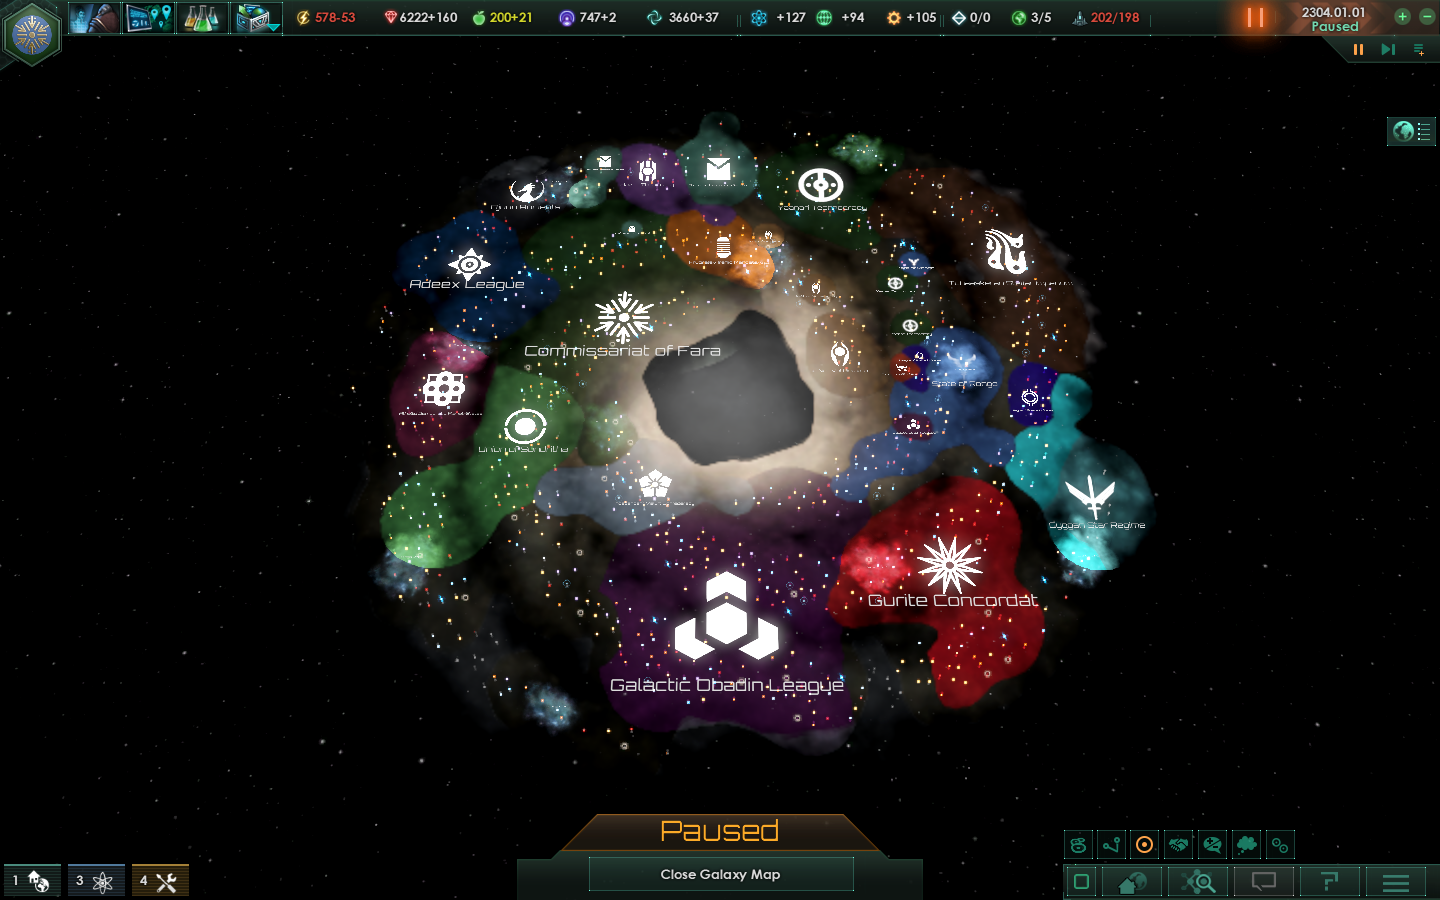
From such a game state:
Generated charts:
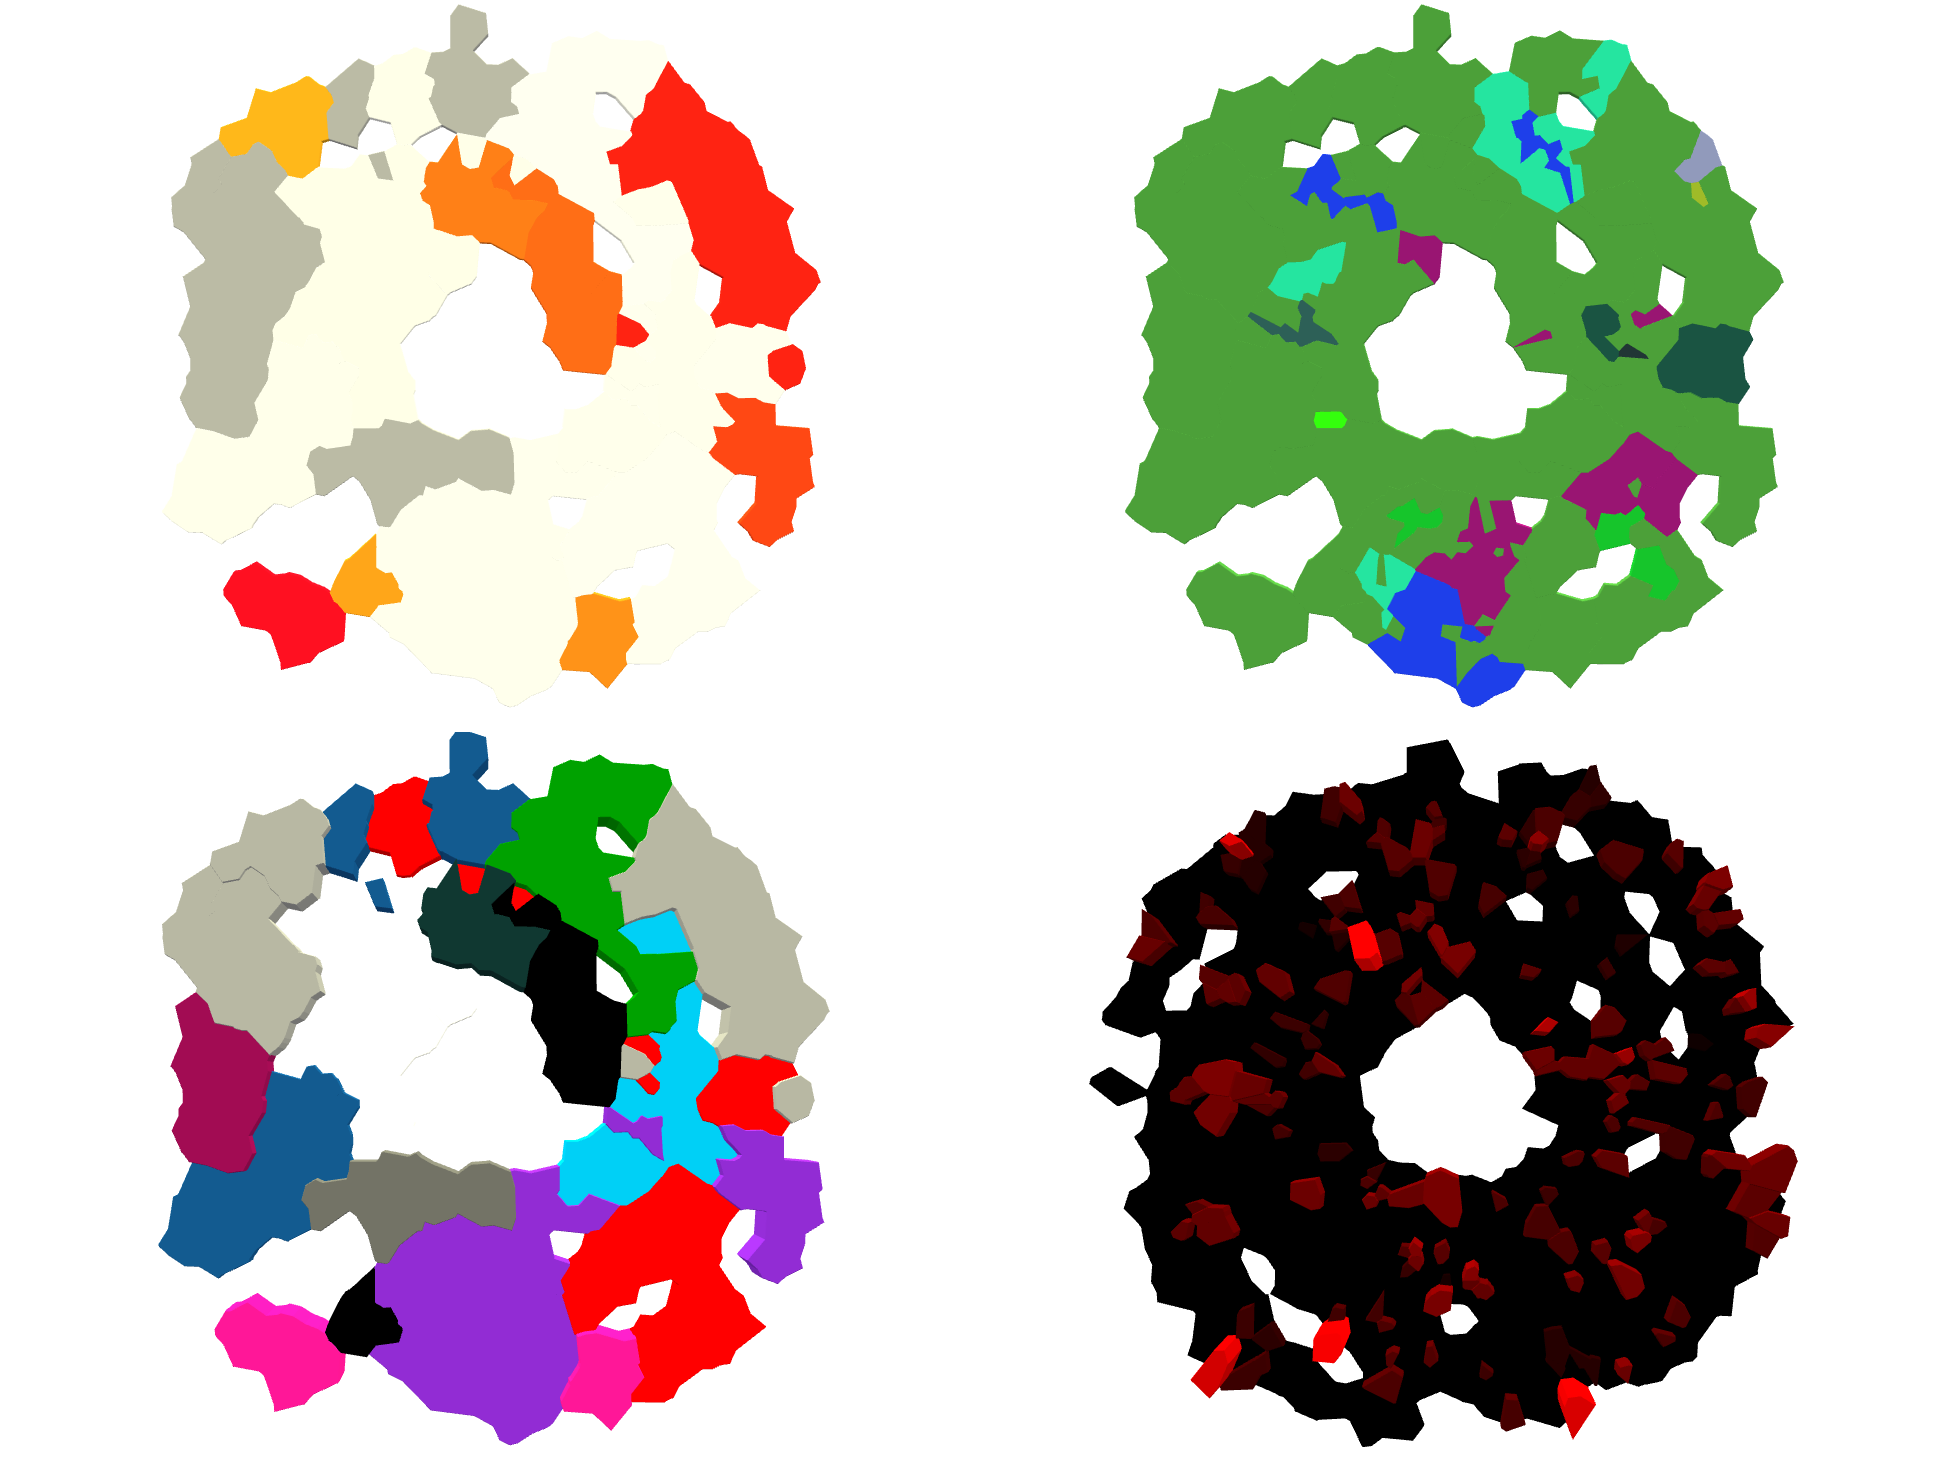
Take special look at different regions that are highlighted:
- Top left corner - independent beings in galaxy (alliances and independent empires)
- Top right corner - sectors
- Bottom left corner - empires
- Bottom right corner - individual solar systems colored by number of pops living there
Those are pretty basic maps that show different levels of details and basic demographic overview that you can achive using those tools. You can analyse your game from "ground" level of solar systems all the way up to independent empires and alliances.