Deep Portfolio Theory is a portfolio selection method published by J. B. Heaton, N. G. Polson, J. H. Witte from GreyMaths Inc.
Authors' codes are proprietary, so I (this github repo owner) can only try to code this notebook myself for experiment. I am not the author and is not related to the original authors. This code may not achieve satisfying results as the paper states. Maybe I misunderstand some parts from the paper, so I hope that someone can continue the research and contribute to the framework. (you are welcome to open issues.)
You may find relevant papers according to the lists:
- Deep Portfolio Theory (we will refer it as "the paper" in all following READMEs)
- Deep Learning for Finance: Deep Portfolios (a more detailed version by the same authors)
-
The authors use "auto-encoding, calibration, validation and verification" as machine learning steps. In computer science, we are more comfortable to call them "auto-encoding, validation, testing and verification". But we will still follow the terms the authors use in this repo.
-
For the graph below in Page 13, for convenience, let's name upper left, upper right, lower left, lower right as A, B, C, D.
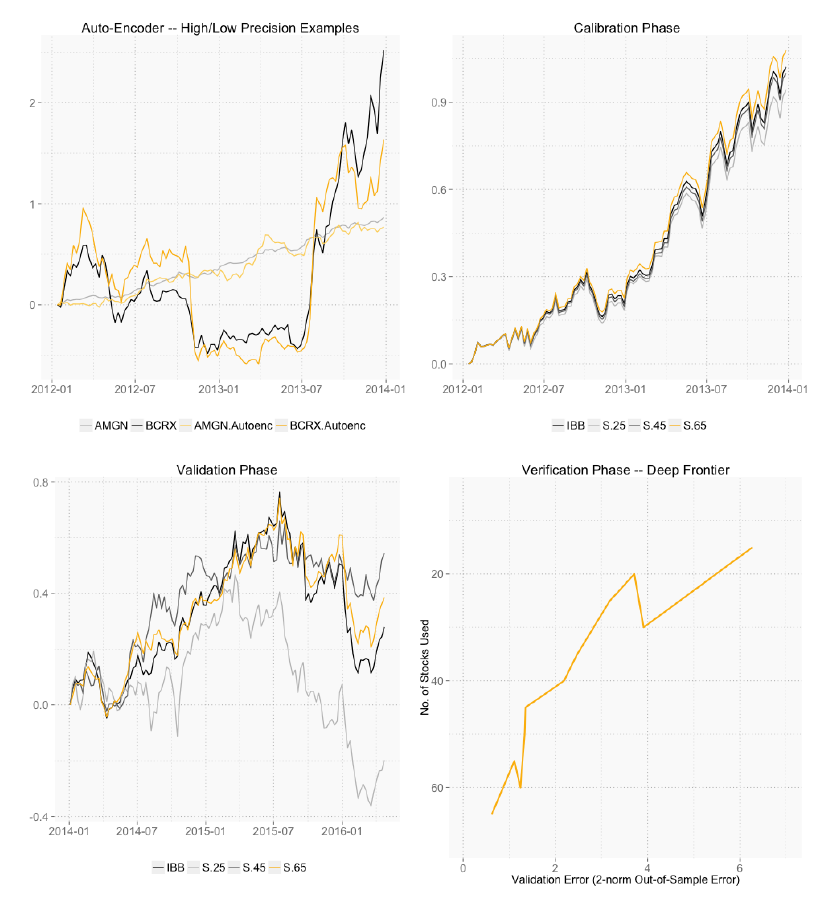
- For all A, B, C, I have no idea about the meaning of Y-axis. From my experiment, Y-axis shall represent the last_price of the stock/Index (so it should be values like 20, 50, 70 instead of 0, 1, 0.6, etc).
- For A, colors are not correct: (TBC..)

Python 3, Keras (Tensorflow Backend)
-
Downloaded from Bloomberg Terminal
-
Dates: from 2012/01/06 to 2016/04/29 (aligned with the paper)
- auto-encoder, calibration set: 2012/01/06 - 2013/12/27, 104 days
- validation, verification set: 2014/01/03 - 2016/04/29, 122 days
-
As Section 2 of the paper states, stock data shall be treated as a matrix
$X \in R^{T \times N}$ , a market of$N$ stocks over$T$ time periods. You can consider it like:$T$ is number of data points (varied),$N$ is number of features (fixed). -
IBB Index Data (ibb_uq.csv)
- PX_LAST
- (absolute) Change
- % Change

- Component Stocks Data (percentage_change.csv)
- Some stock data are missing (not IPO yet, etc), so for data preprocessing, I ignore all the data without full record during 2012/01/06 to 2016/04/29.
- In this notebook I only use percentage change as input. I also prepare net_change, last_price in the repo if you are interested.
