

![]()
Dev Lake is the one-stop solution that integrates, analyzes, and visualizes software development data throughout the software development life cycle (SDLC) for engineering teams.
- Supports various data sources (Gitlab, Jira) and more are being added all the time
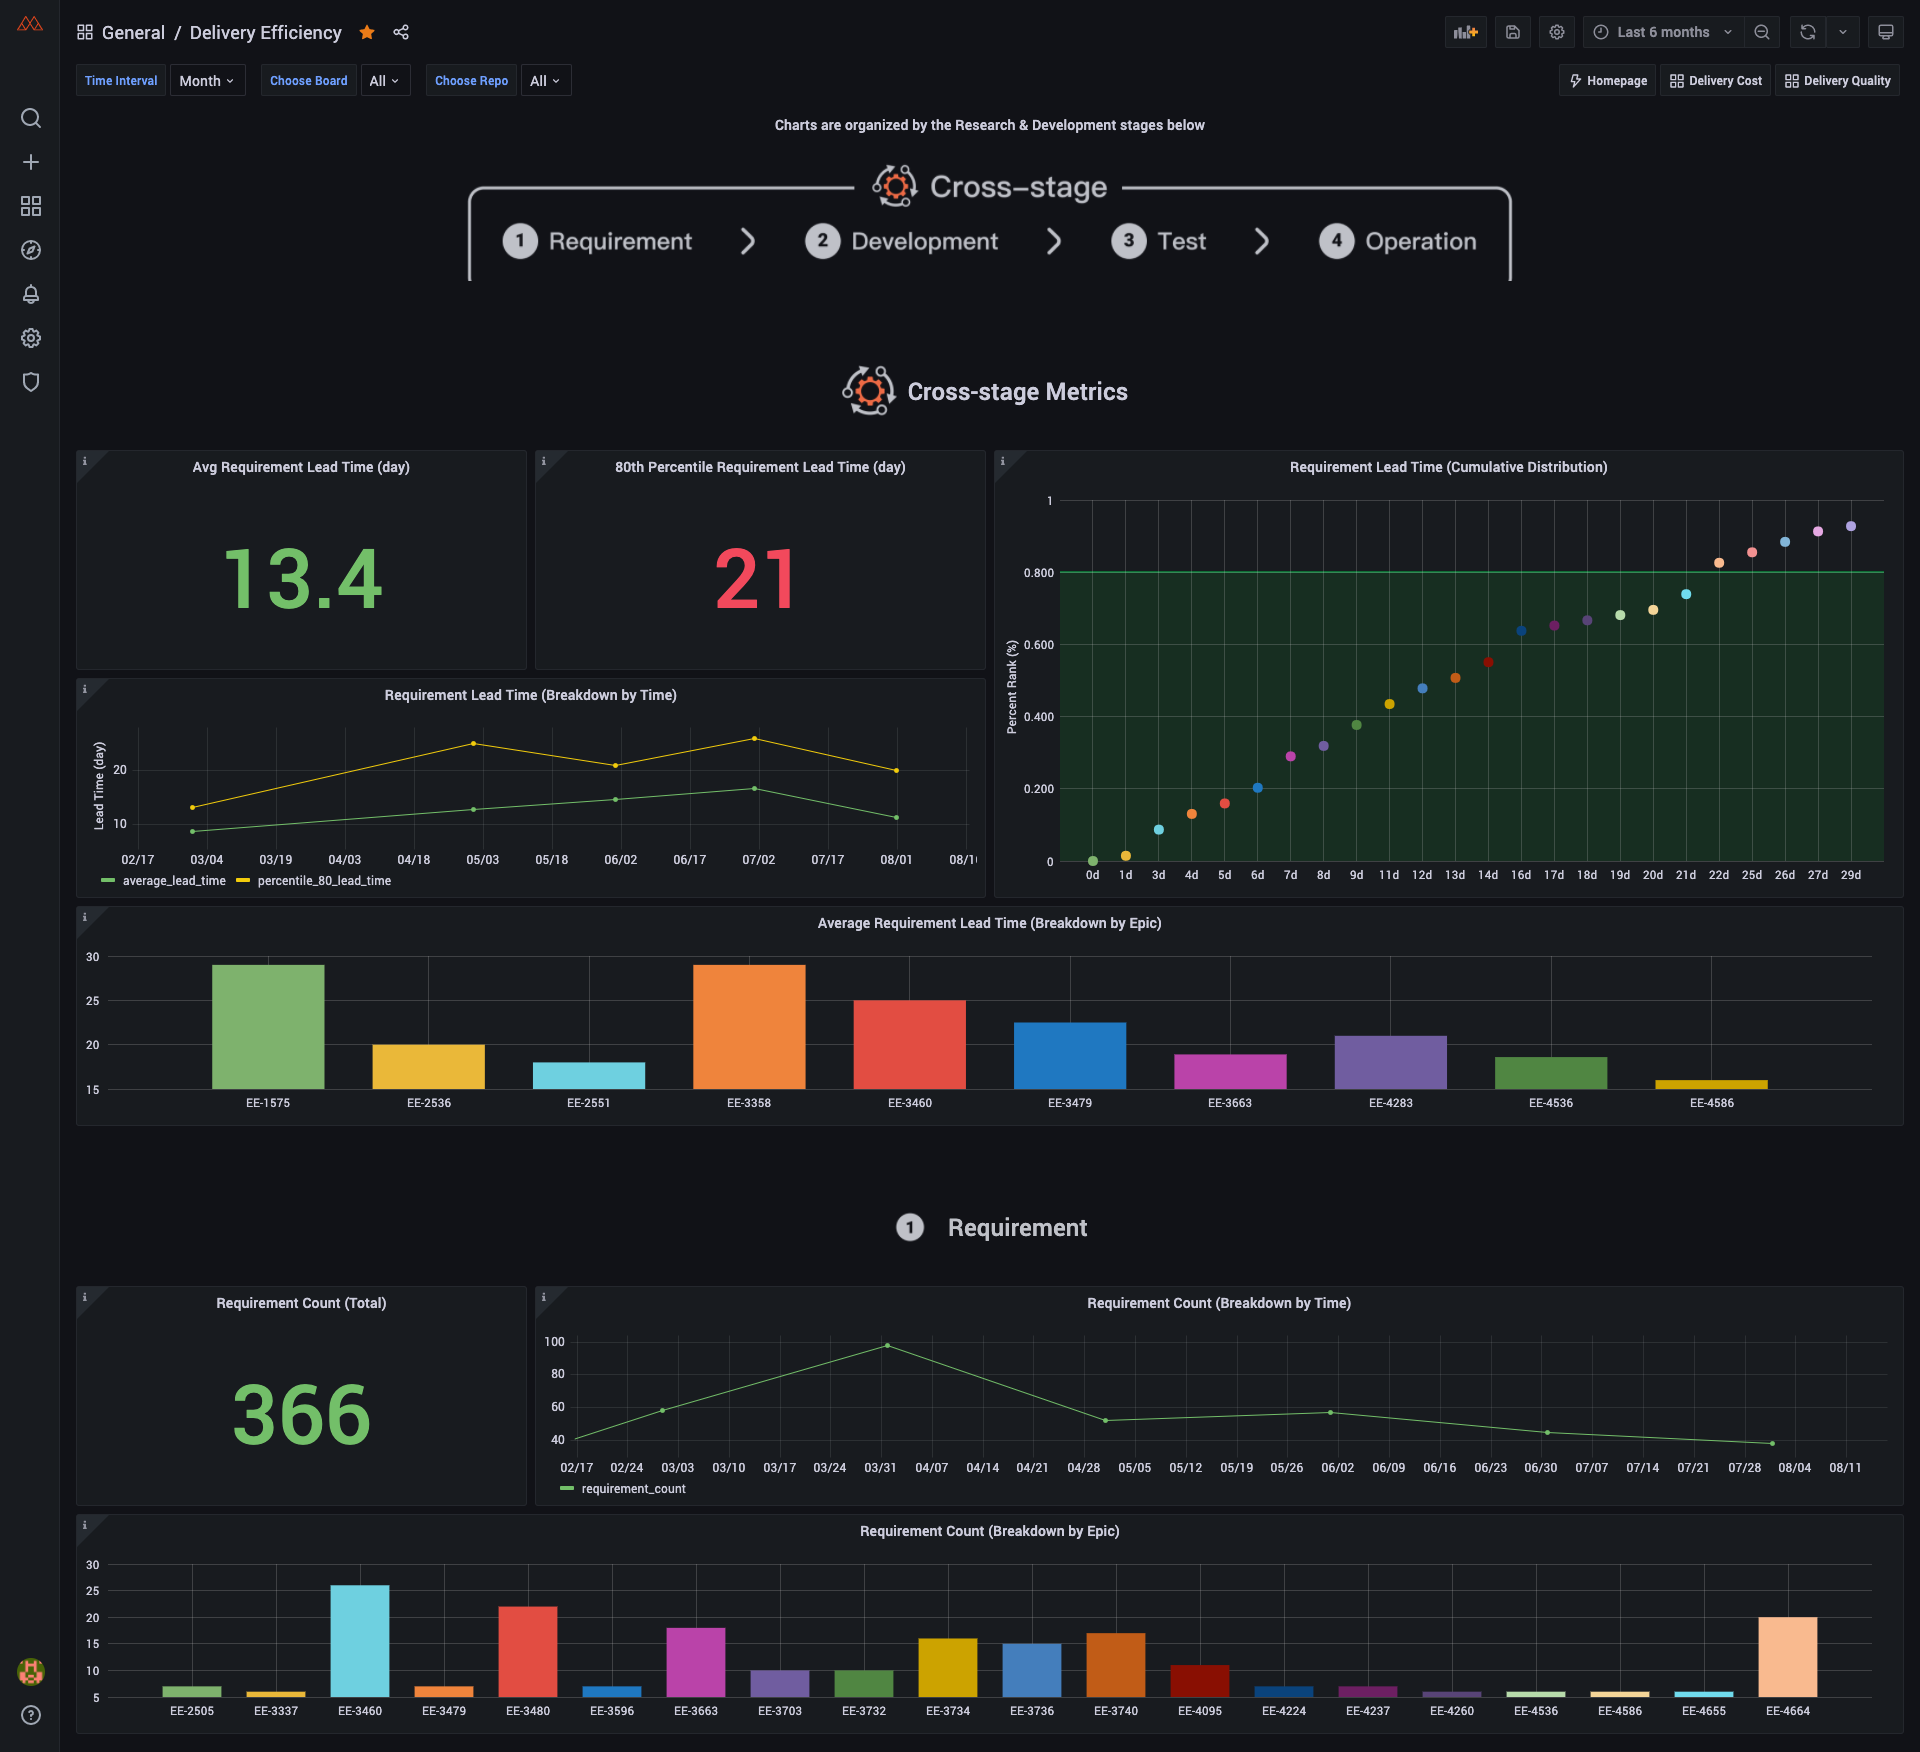
- Relevant, customizable data metrics ready to view as visual charts
- Easily build and view new charts and dashboards with Grafana
- Easy-to-setup via Docker
- Extensible plugin system to add your own data collectors
- Designed to process enterprise-scale data
| Section | Description | Documentation Link |
|---|---|---|
| Requirements | Underlying software used | View Section |
| User Setup | Quick and easy setup | View Section |
| Data Source Plugins | Links to specific plugin usage & details | View Section |
| Developer Setup | Steps to get up and running | View Section |
| Build a Plugin | Details on how to make your own | Link |
| Add Plugin Metrics | Guide to adding plugin metrics | Link |
| Grafana | How to visualize the data | Link |
| Contributing | How to contribute to this repo | Link |
Below is a list of data source plugins used to collect & enrich data from specific sources. Each have a README.md file with basic setup, troubleshooting and metrics info.
For more information on building a new data source plugin see Build a Plugin.
| Section | Section Info | Docs |
|---|---|---|
| Jira | Metrics, Generating API Token, Find Project/Board ID | Link |
| Gitlab | Metrics, Generating API Token | Link |
We use Grafana as a visualization tool to build charts for the data stored in our database. Using SQL queries we can add panels to build, save, and edit customized dashboards.
All the details on provisioning, and customizing a dashboard can be found in the Grafana Doc
NOTE: If you only plan to run the product, this is the only section you should need
NOTE: Commands written like this are to be run in your terminal
NOTE: After installing docker, you may need to run the docker application and restart your terminal
-
Navigate to where you would like to install this project and clone the repository
git clone https://github.com/merico-dev/lake.git cd lake -
Install npm packages with
npm install -
Run the command
npm run configto setup your configuration filesFor more info on how to configure plugins, please refer to the data source plugins section
To map a custom status for a plugin refer to
/config/plugins.js
Ex: In Jira, if you're using Rejected as a Bug type, refer to thestatusMappingssections for issues mapped to "Bug"
AllstatusMappingscontain 2 objects. an open status (first object), and a closed status (second object) -
Start the service by running the command
npm startyou can stop all docker containers with
npm run stop -
Run
docker-compose -f docker-compose.yml -f docker-compose.prod.yml logs -f laketo check the logs and see when lake stops collecting your data. This can take up to 20 minutes for large projects. (gitlab 10k+ commits or jira 5k+ issues) -
Navigate to Grafana Dashboard
https://localhost:3002(Username:admin, password:admin)
Message us on Discord