Grafana Datasource for JasperReports
This project is a proof-of-concept for generating PDF reports that contain panels from a Grafana dashboard using JasperReports.
Using the datasource
Build the package:
mvn clean installPoint to your Grafana instance:
$ cat ~/.grafana/server.properties
url = https://grafana:3000
apiKey = your_key
Download and install JasperStudio 6.3.0: https://sourceforge.net/projects/jasperstudio/files/JaspersoftStudio-6.3.0/
Create a new project in JasperStudio.
Copy the flows.jrxml template from the assets directory to the project.
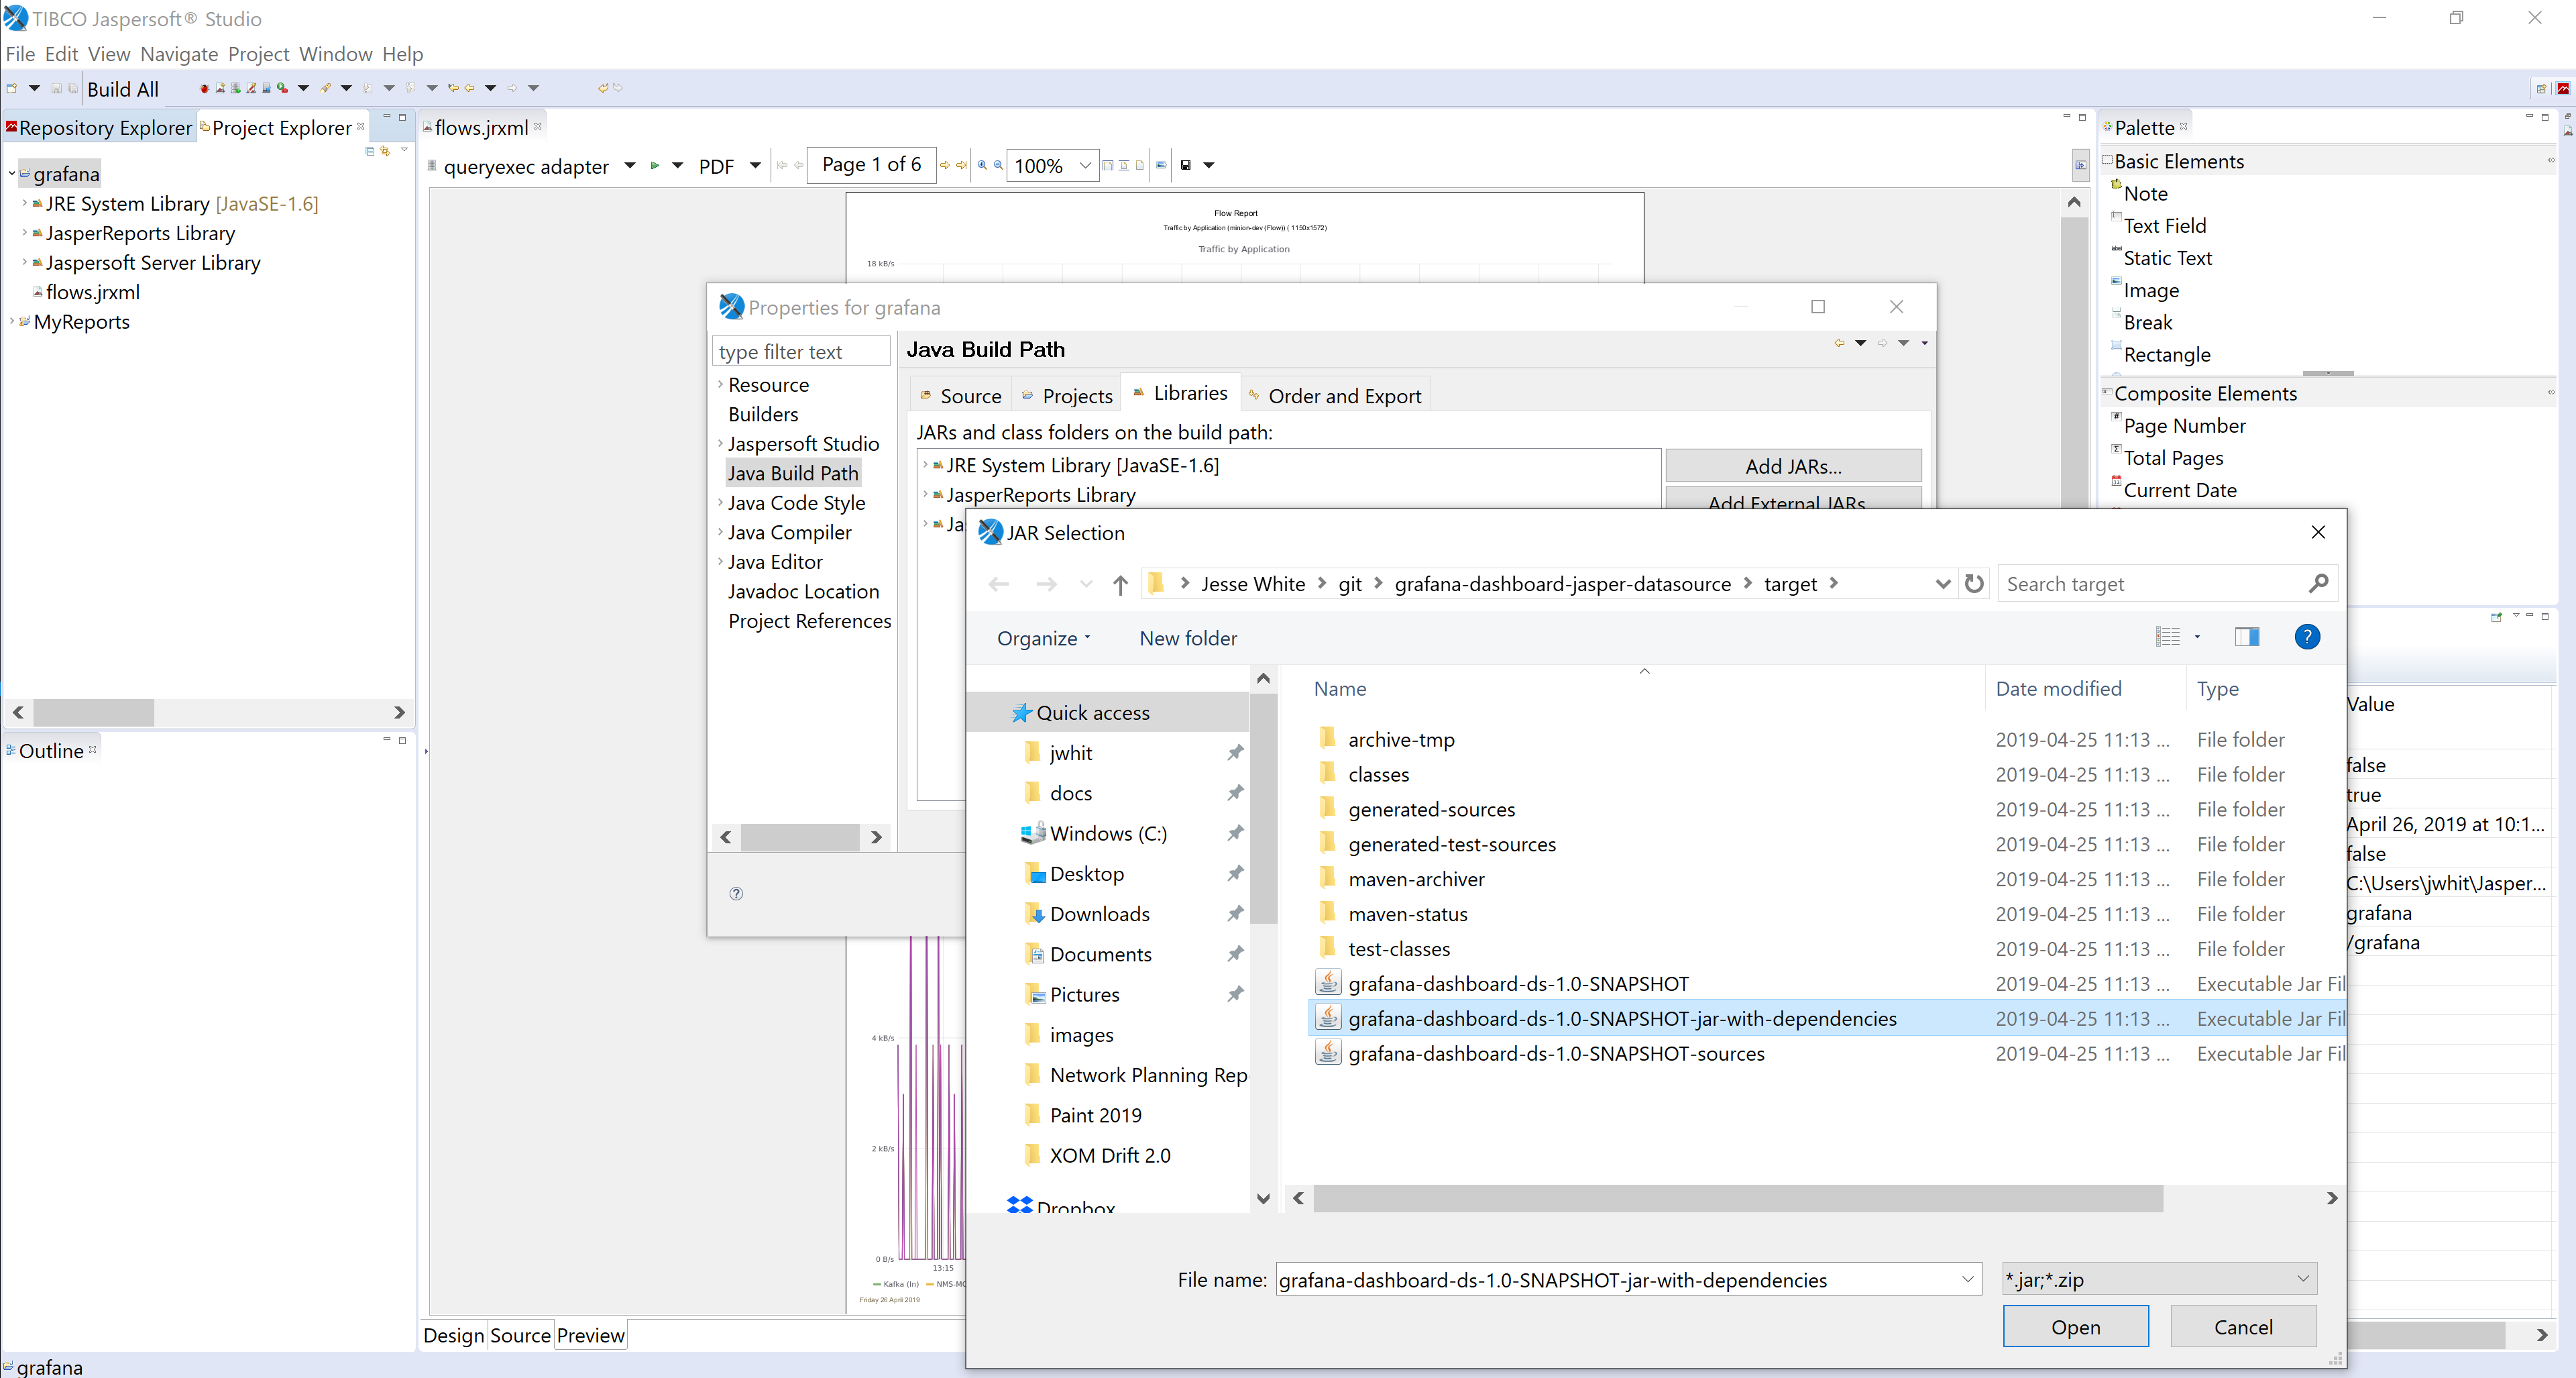
Add the fat .jar to the classpath of your project:
Add a new "Query Executor adapter" to the project: Project → New > Data Adapter → Query Executor adapter
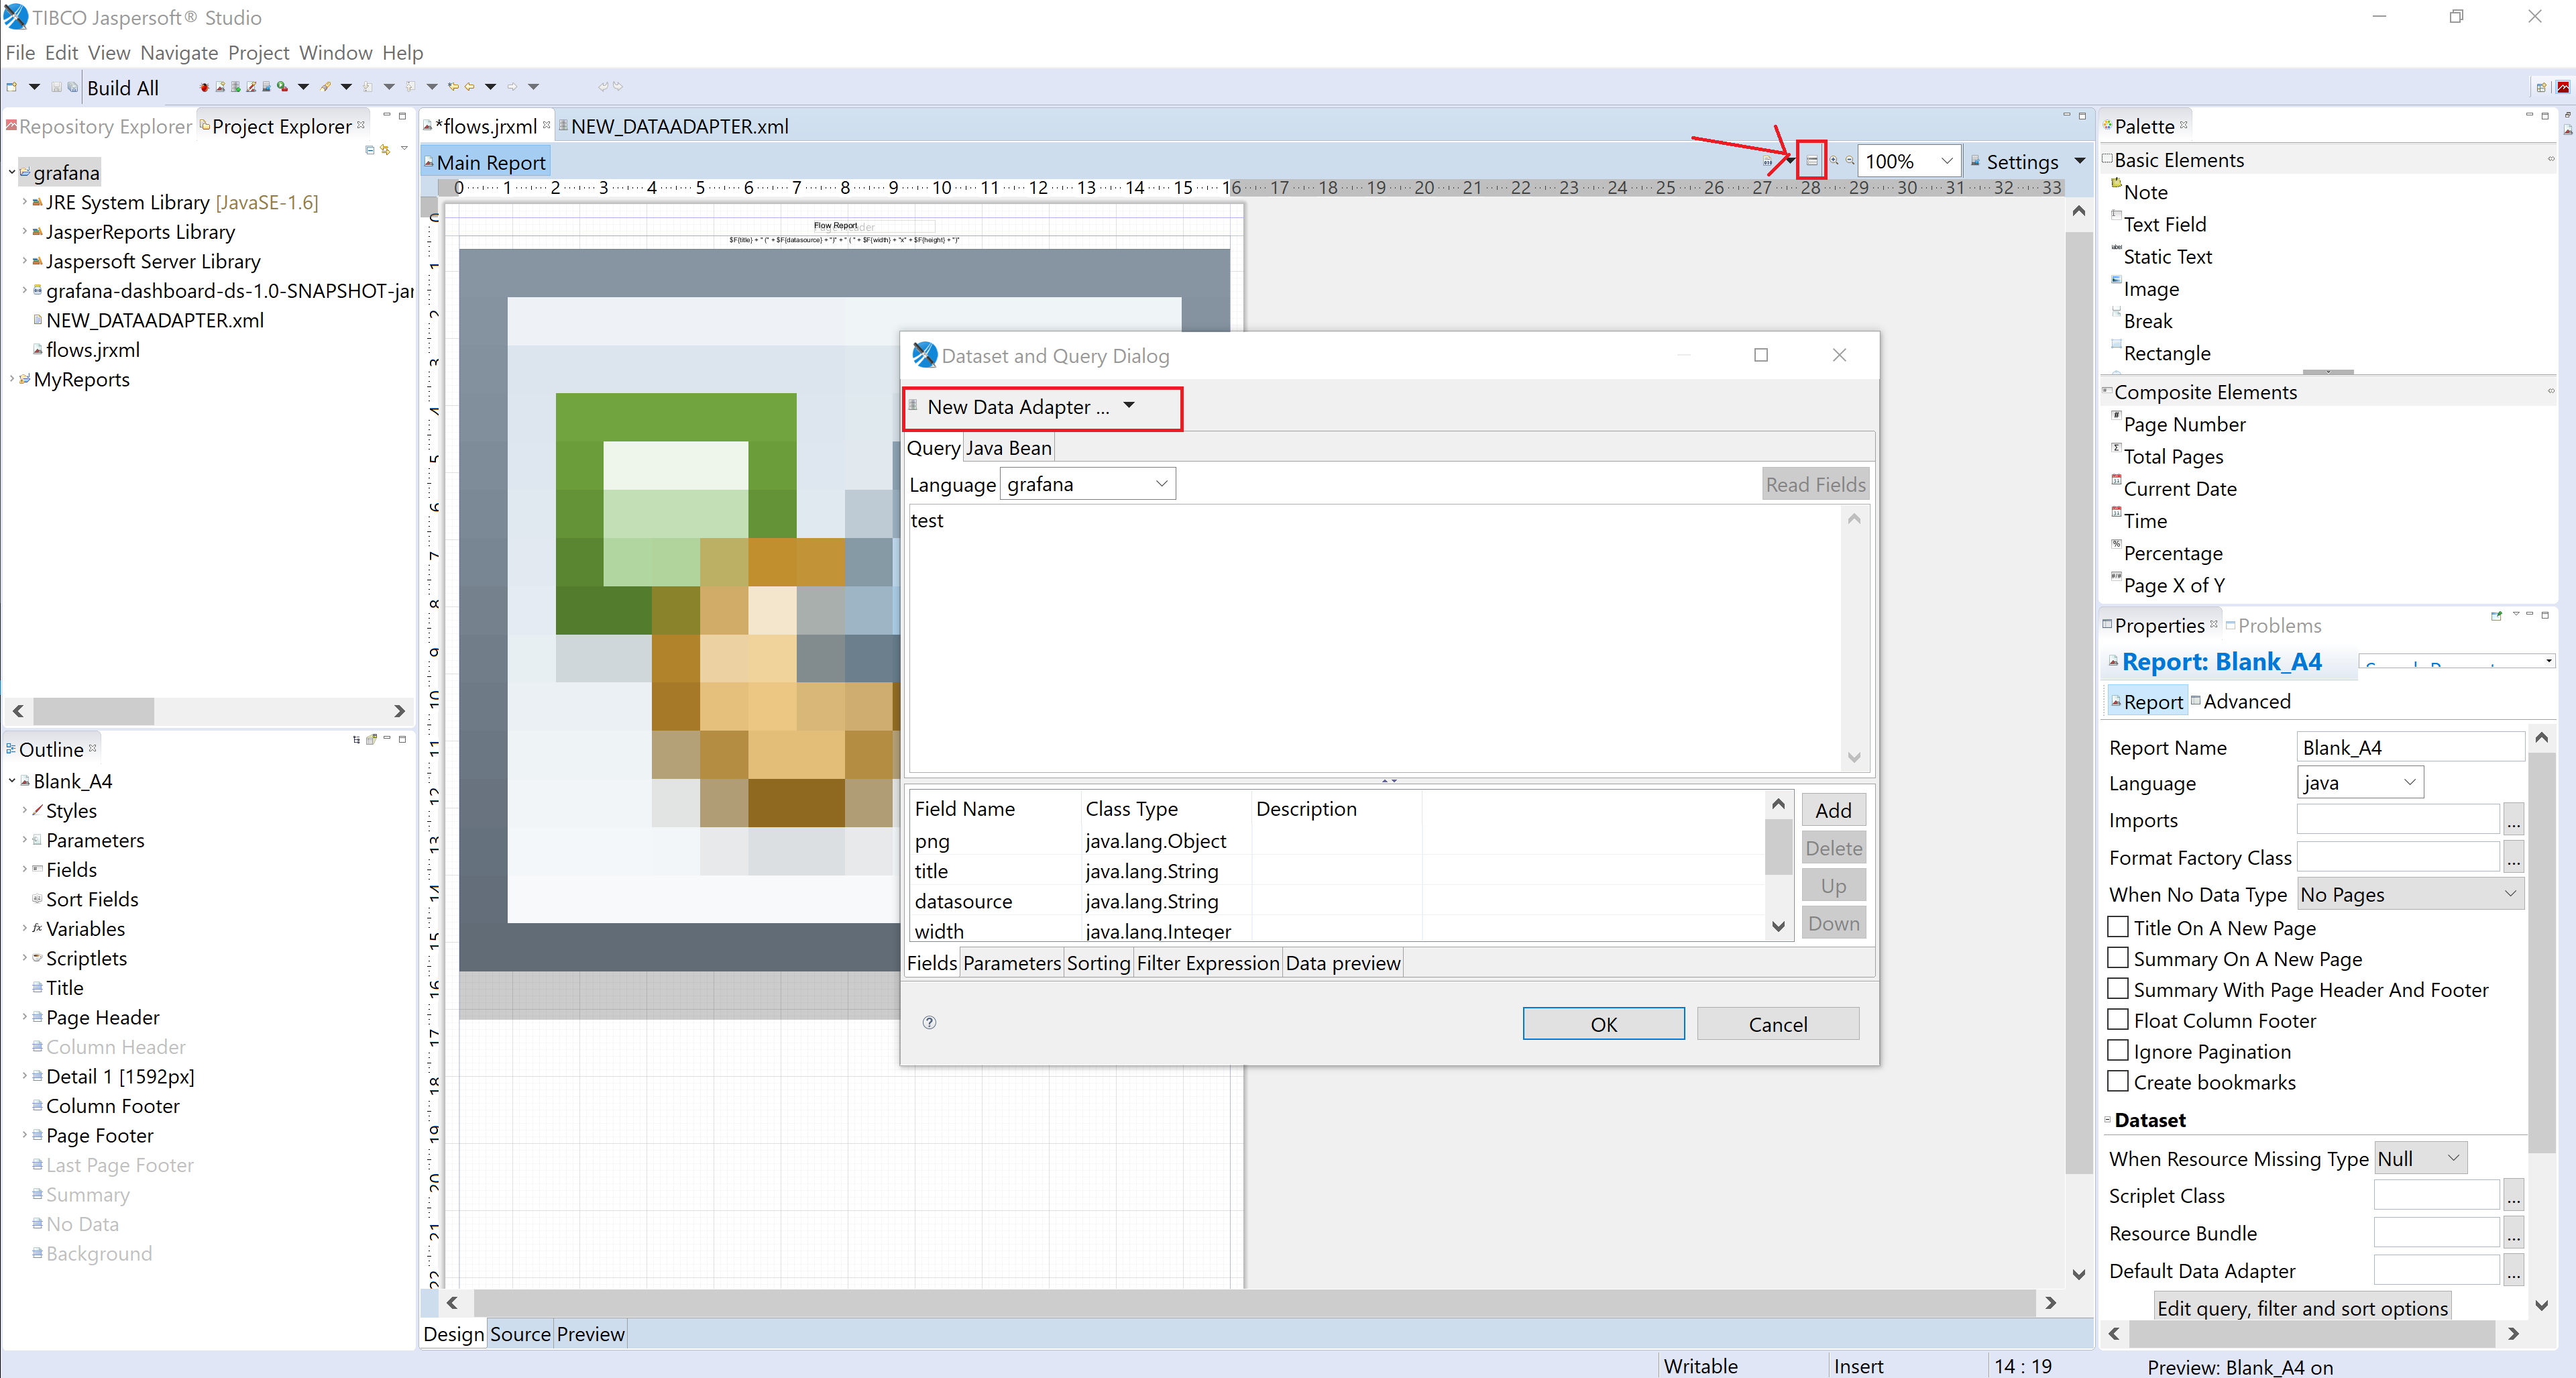
Configure the report to use the new Query Executor adapter:
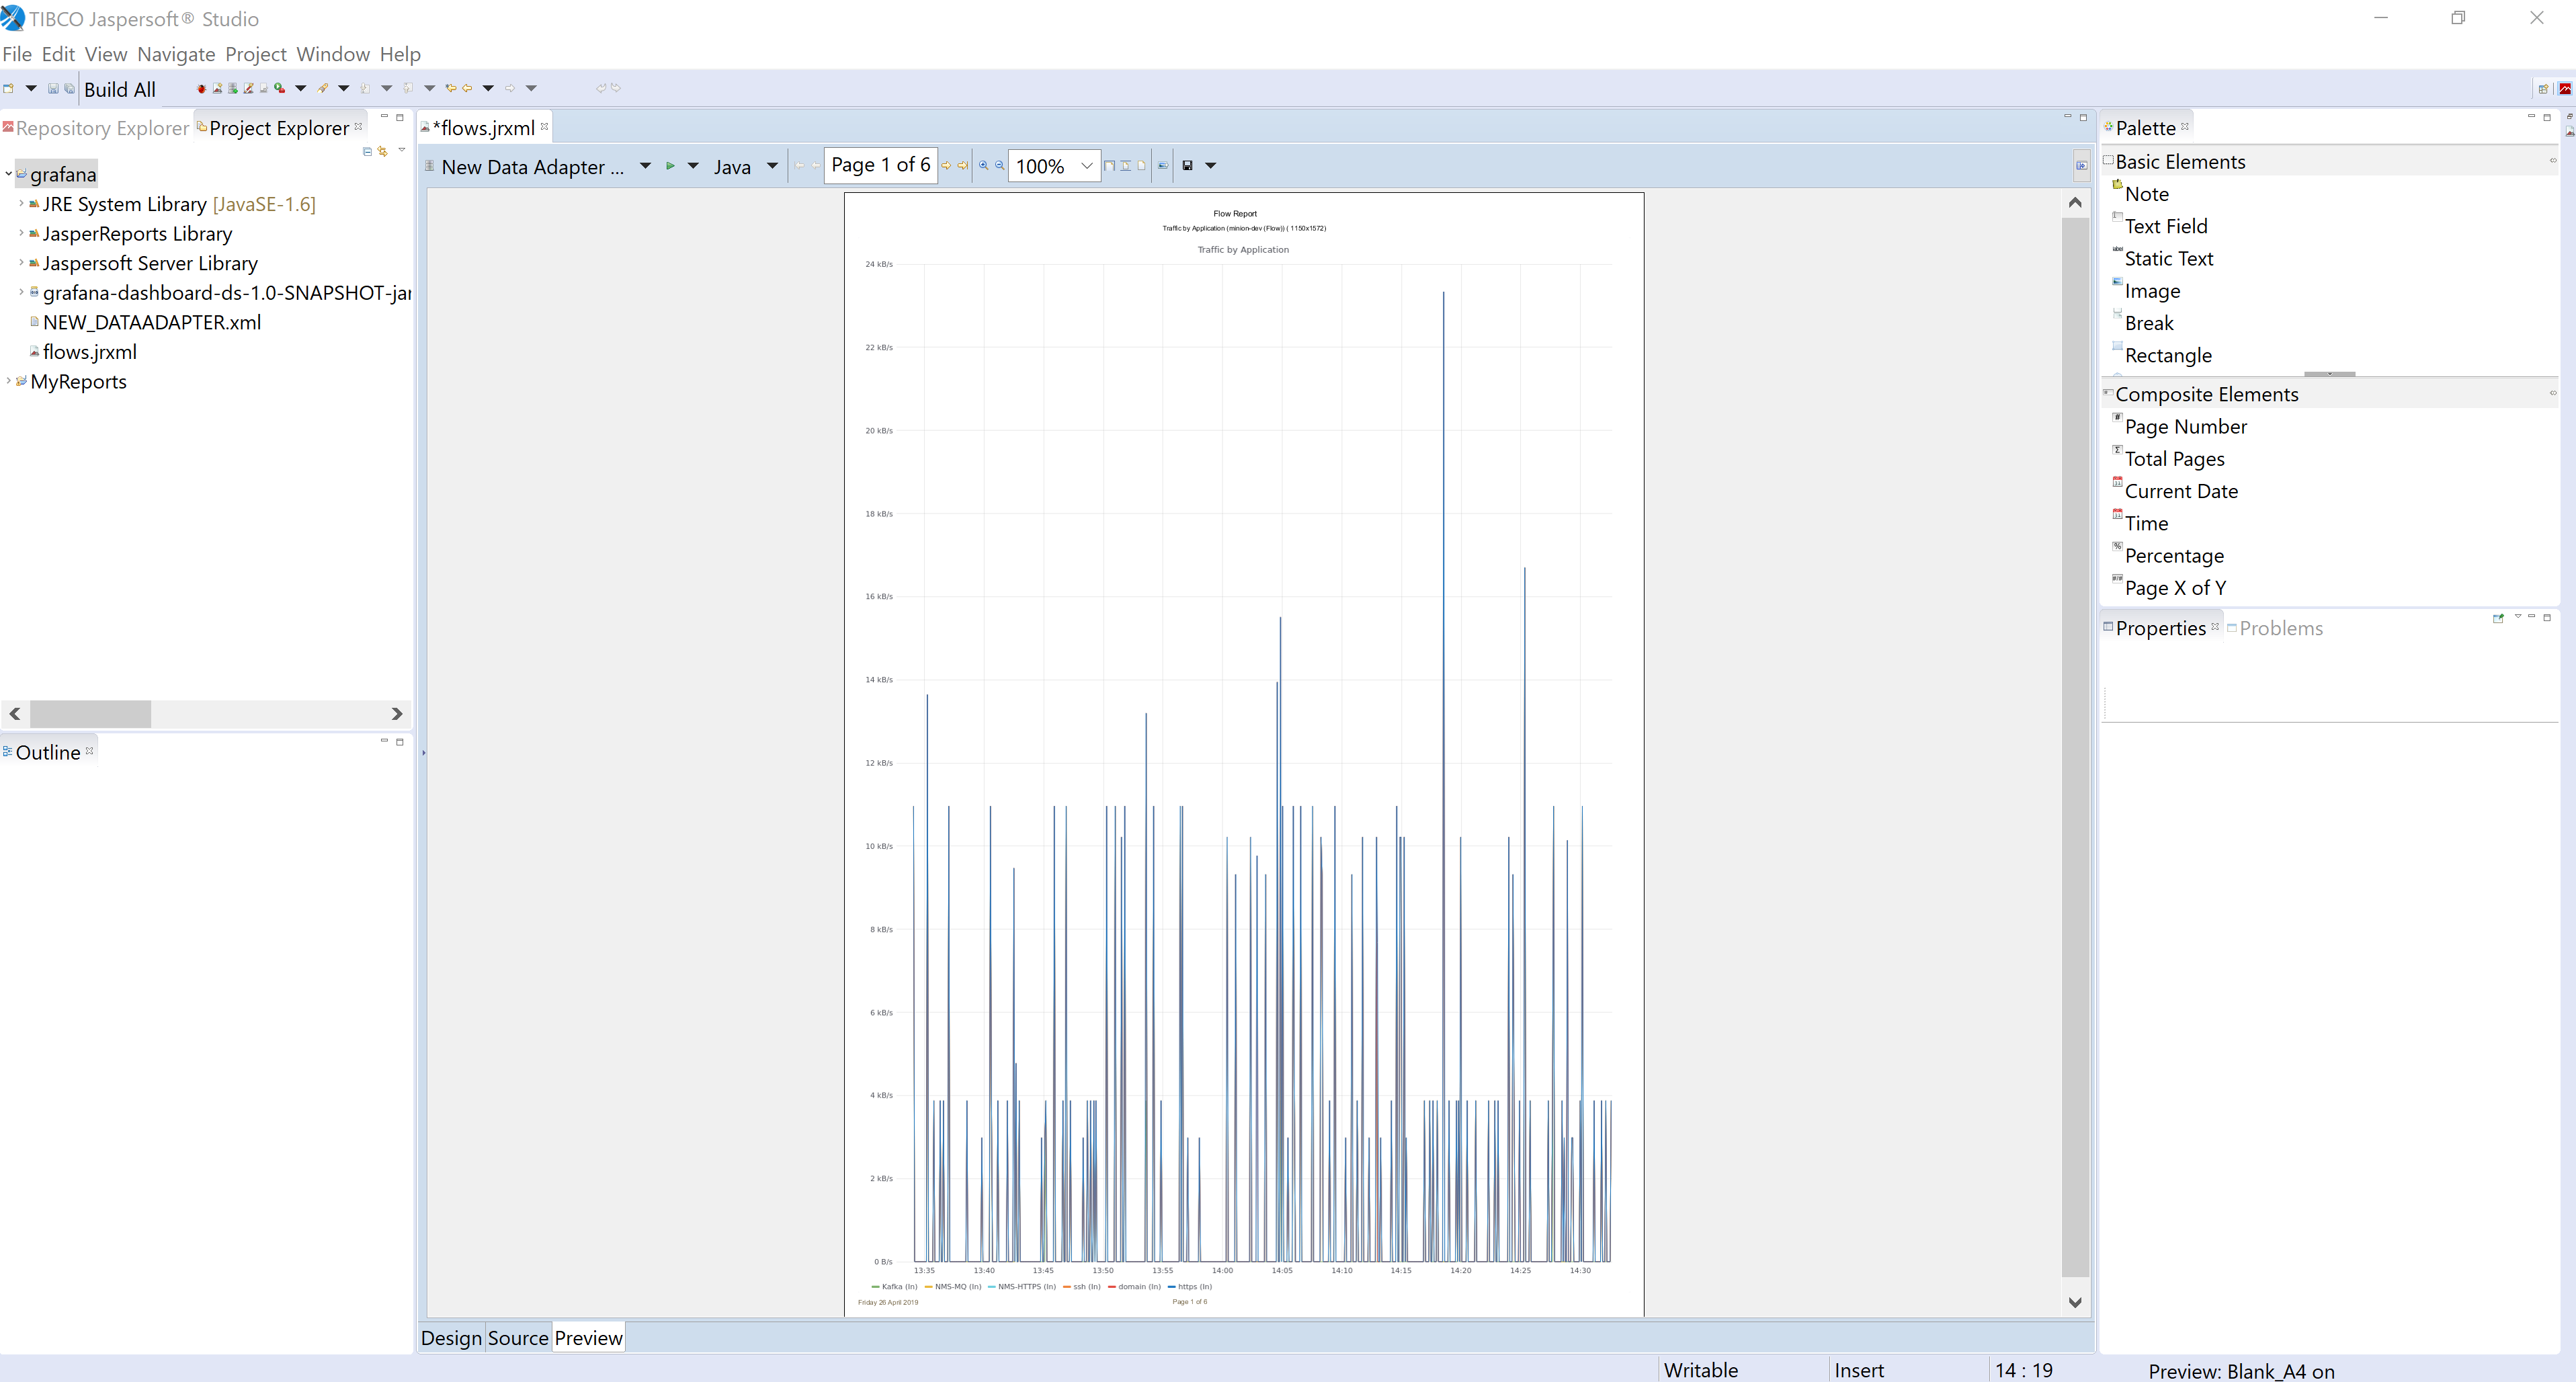
Preview/render the report:
Query String
The query string for the datasource should look like:
{
    "dashboard": {
      "uid": "eWsVEL6zz"
    },
    "time": {
      "from": $P{startDateTime},
      "to": $P{endDateTime}
    },
    "render": {
      "width": 1149,
      "height": 1572,
      "theme": "light"
    },
    "variables": {
      "node": "1",
      "interface": "2"
    }
}

