The Goal of this project: understand the client-side Kafka metrics for both consumer and producers. With the focus on client-side consumer lag metrics and understanding how they should be interpreted compared to the consumer lag numbers available on the Kafka broker(s).
This small project can be used to reproduce the difference in consumer lag numbers.
The context for the example:
- Teams using Kafka should be able to monitor their own applications using client-side Kafka metrics
- Without having access to Kafka broker metrics, because the Kafka cluster is owned by a platform team and the team using Kafka doesn't have access to the broker metrics.
Note that this metric differs from the output of the kafka-consumer-groups command output in two ways.
- Rebalancing Consumer Groups returns the last value for lag from before rebalancing until it completes.
- Consumer Groups with no active Consumers are not returned in the result.
- Why are the consumer lag metrics number so far off compared with the consumer lag numbers available from the broker?
- Are the client-side metrics (especially the client-side consumer lag metrics) reliable enough to be used in dashboards and eventually to alert on?
- Do we interpret the consumer lag metrics in a wrong way?
From the Confluent - Monitor Consumer Lag documentation.
records-lag- Description: The latest lag of the partition.
- In Prometheus:
kafka_consumer_fetch_manager_records_lag - Type:
gauge - See:
kafka_consumer_fetch_manager_records_lagmetric in Prometheus
records-lag-avg- Description: The average lag of the partition.
- In Prometheus:
kafka_consumer_fetch_manager_records_lag_avg - Type:
gauge - See:
kafka_consumer_fetch_manager_records_lag_avgmetric in Prometheus
records-lag-max- Description: The max lag of the partition.
- In Prometheus:
kafka_consumer_fetch_manager_records_lag_max - Type:
gauge - See:
kafka_consumer_fetch_manager_records_lag_maxmetric in Prometheus
records-lag-max- Description:
The maximum lag in terms of number of records for any partition in this window. An increasing value over time is your best indication that the consumer group is not keeping up with the producers. - Type:
gauge
- Description:
| Applications | Port | Avro | Topic(s) | Description |
|---|---|---|---|---|
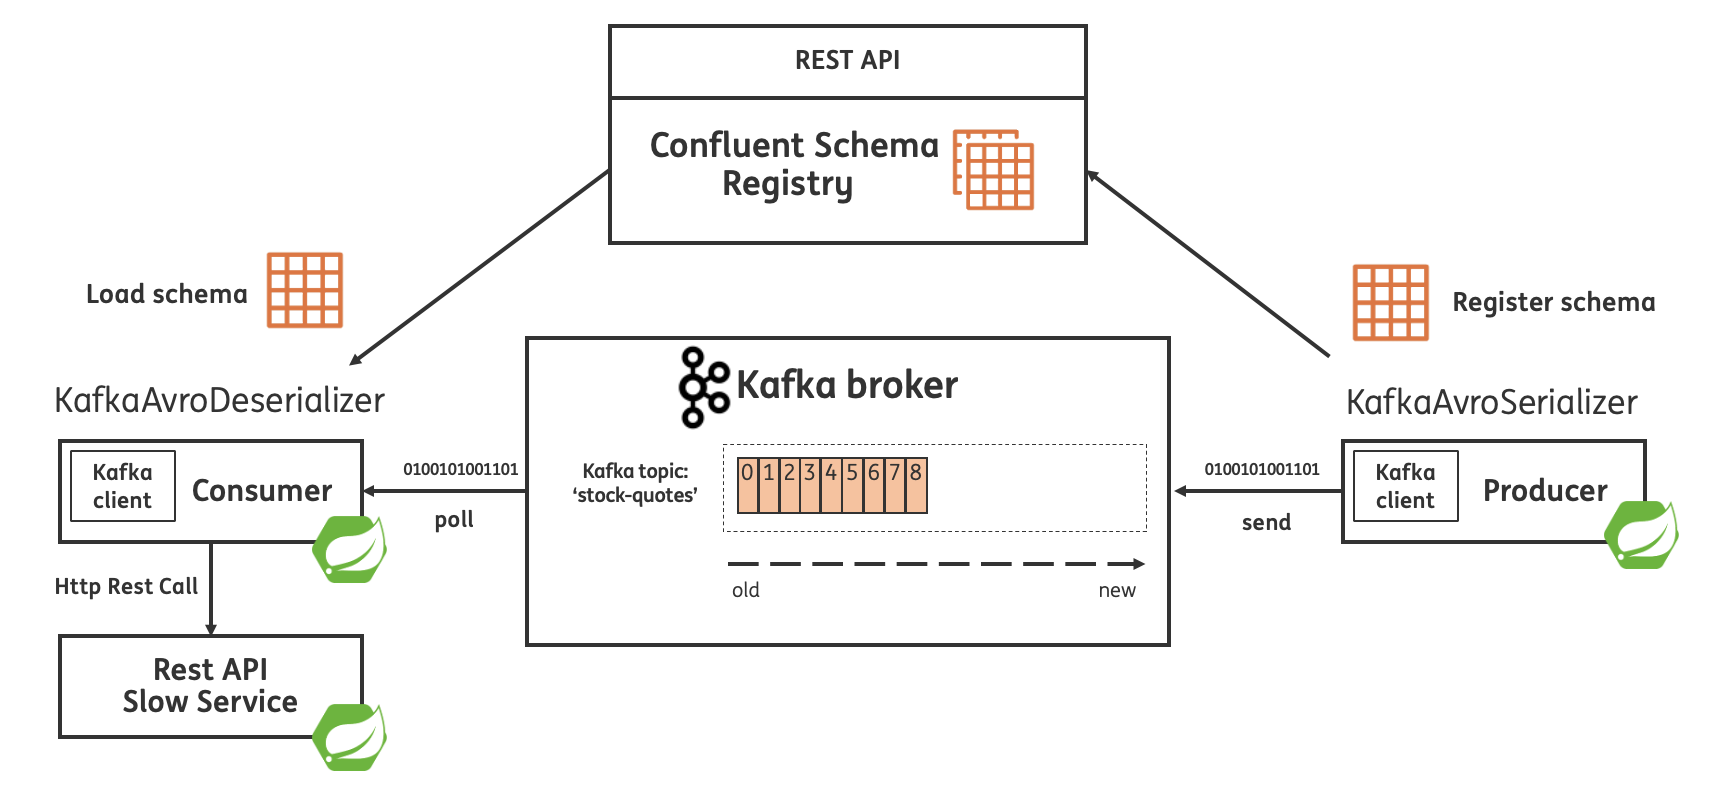
| spring-kafka-producer | 8080 | YES | stock-quotes | Simple producer of random stock quotes using Spring Kafka & Apache Avro. |
| spring-kafka-consumer | 8082 | YES | stock-quotes | Simple consumer of stock quotes using using Spring Kafka & Apache Avro. This application will call the slow REST API, building up consumer lag |
| slow-downstream-service | 7999 | NO | Simple application exposing a slow performing REST API. |
| Module | Description |
|---|---|
| avro-model | Holds the Avro schema for the Stock Quote including avro-maven-plugin to generate Java code based on the Avro Schema. This module is used by both the producer, consumer and Kafka streams application. |
Note Confluent Schema Registry is running on port: 8081 using Docker see: docker-compose.yml.
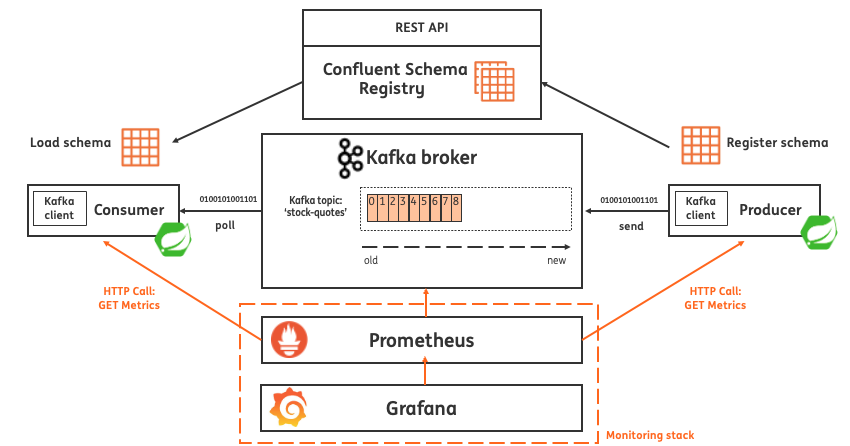
Including monitoring:
- Consumer instance 1 Actuator Prometheus Endpoint http://localhost:8080/actuator/prometheus
- Consumer instance 2 Actuator Prometheus Endpoint http://localhost:8083/actuator/prometheus
- Consumer instance 3 Actuator Prometheus Endpoint http://localhost:8084/actuator/prometheus
- Topic name:
stock-quotes - Number of partitions: 3
For more information see the: Topic Details
- Confluent Kafka: 7.2.x
- Confluent Schema Registry: 7.2.x
- Java: 11
- Spring Boot: 2.7.x
- Spring for Apache Kafka: 2.8.x
- Apache Avro: 1.11
- Prometheus: v2.40.x
- Grafana: 9.2.x
- Kafka (port 9092)
- Zookeeper (port 2181)
- Schema Registry
- Kafka UI
- Prometheus
- See scraped targets
- Grafana
- Dashboard
- Consumer dashboard (based on Kafka client-side metrics)
./mvnw clean installdocker-compose up -d./mvnw spring-boot:run -pl spring-kafka-producerOnce started this application start producing a Stock Quote every 10ms to produce load on the topic stock-quotes
The producer application will expose Kafka client metrics via Micrometer ready for Prometheus to scrape.
This application will simulate a slow API that will be called by the spring-kafka-consumer application to intentionally build up consumer lag!
See: RestApi.java
./mvnw spring-boot:run -pl slow-downstream-serviceNow start the consumer application (open a new terminal)
./mvnw spring-boot:run -pl spring-kafka-consumerThe consumer application will expose Kafka client metrics via Micrometer ready for Prometheus to scrape.
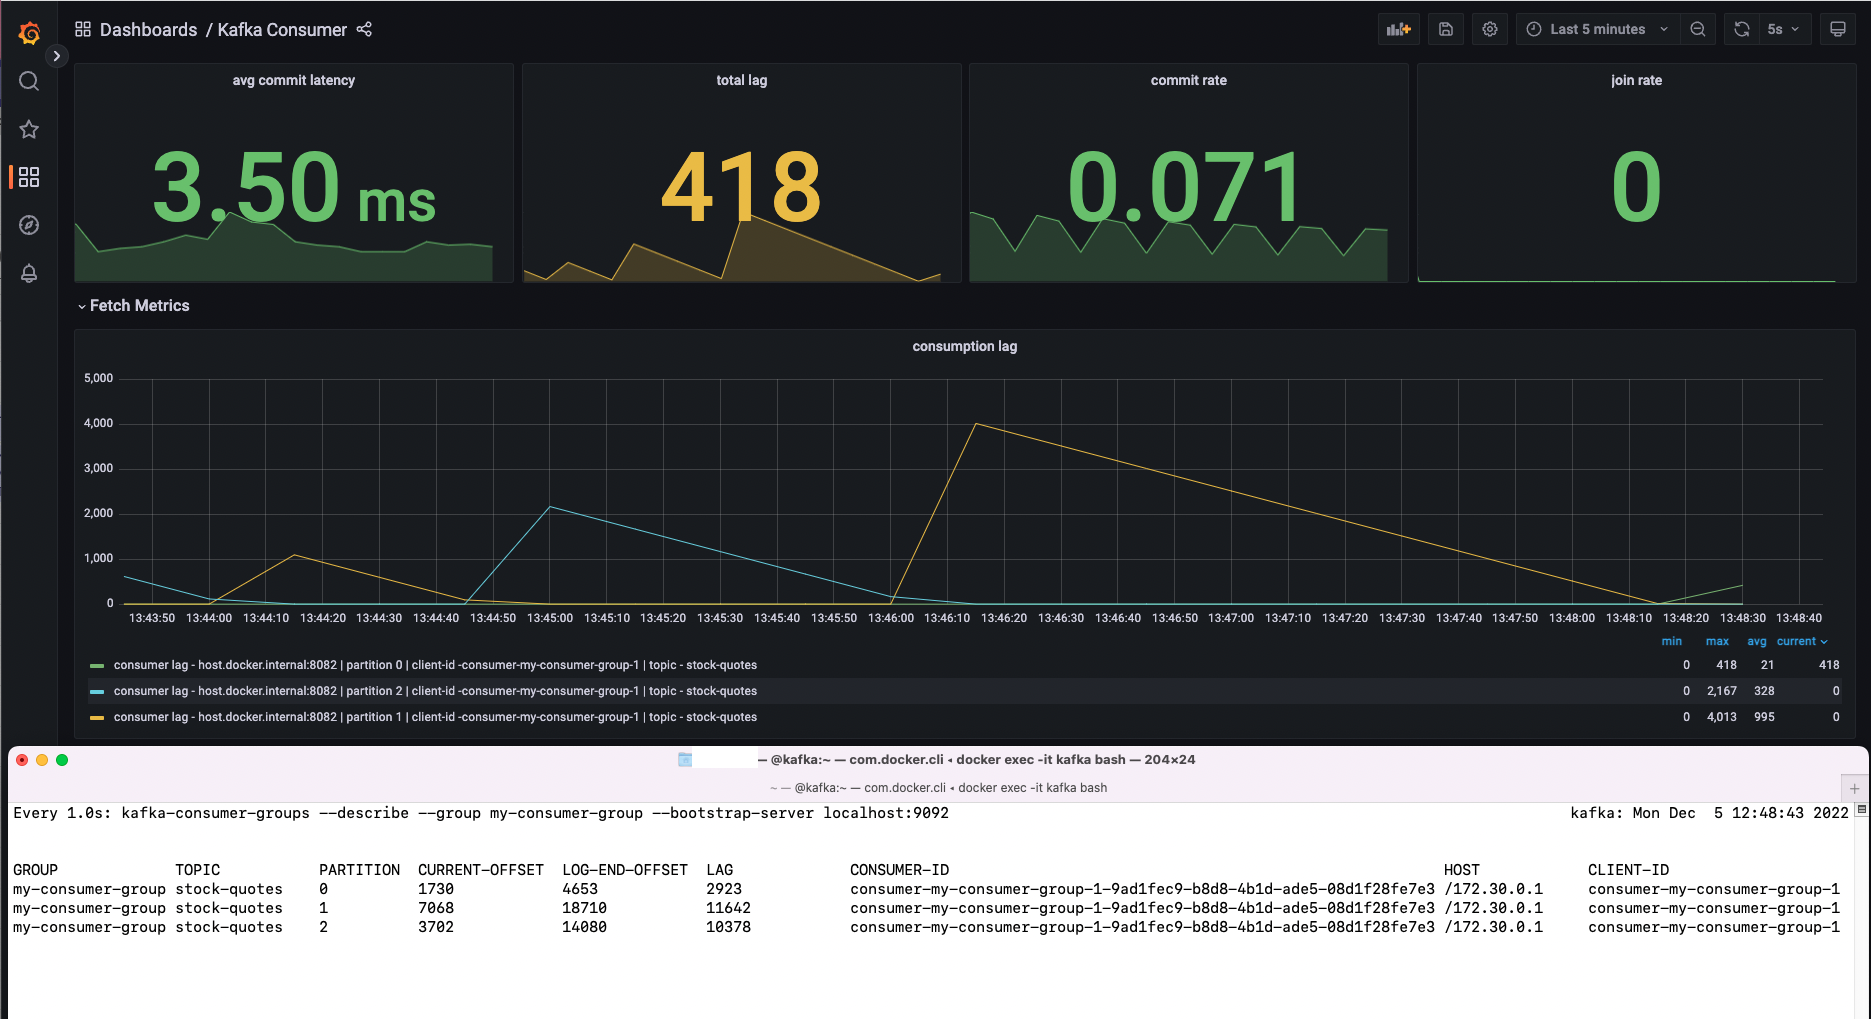
Although the consumer is consuming all 3 partitions only one partition is consumed concurrently. So this explains why only the metrics for one partition are available.
From the documentation:
- Consumer Groups with no active Consumers are not returned in the result.
The producer is producing more data to Kafka the consumer can handle. The result is the consumer is building up some consumer lag
We are in particular interested in the following metrics:
kafka_consumer_fetch_manager_records_lagkafka_consumer_fetch_manager_records_lag_avgkafka_consumer_fetch_manager_records_lag_max
Compare with the lag on the broker:
Attach to the Kafka broker running in Docker:
docker exec -it kafka bashUnset the JXM Port
unset JMX_PORTSee the consumer lag:
watch --interval 1 kafka-consumer-groups --describe --group my-consumer-group --bootstrap-server localhost:9092We see the client-side metrics are far off compared to the lag number available on the broker:
Let's start 2 more consumers. So we have 3 concurrent consumer threads running. Also give it a consumers a bit of time to rebalance.
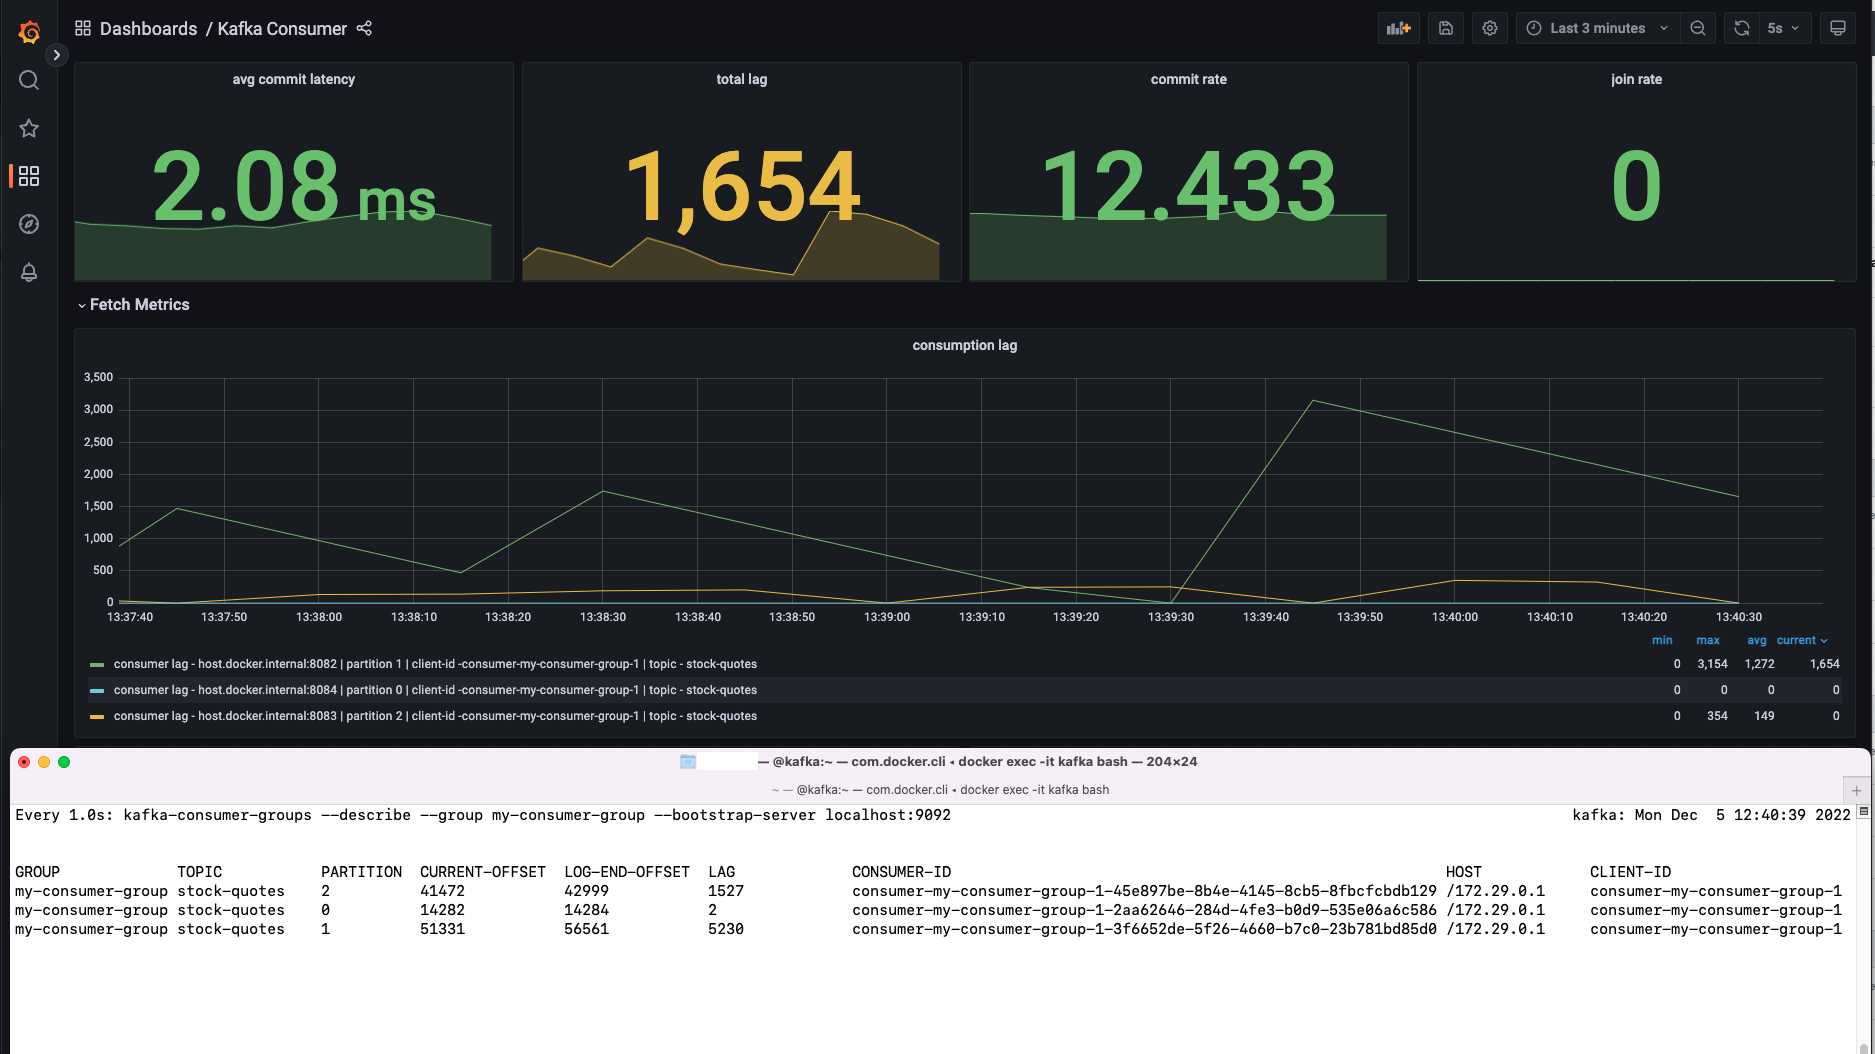
Since we have 3 concurrent consumers (concurrently reading from all the 3 partitions) we have metrics for all 3 partitions.
Run another two more consumer instances:
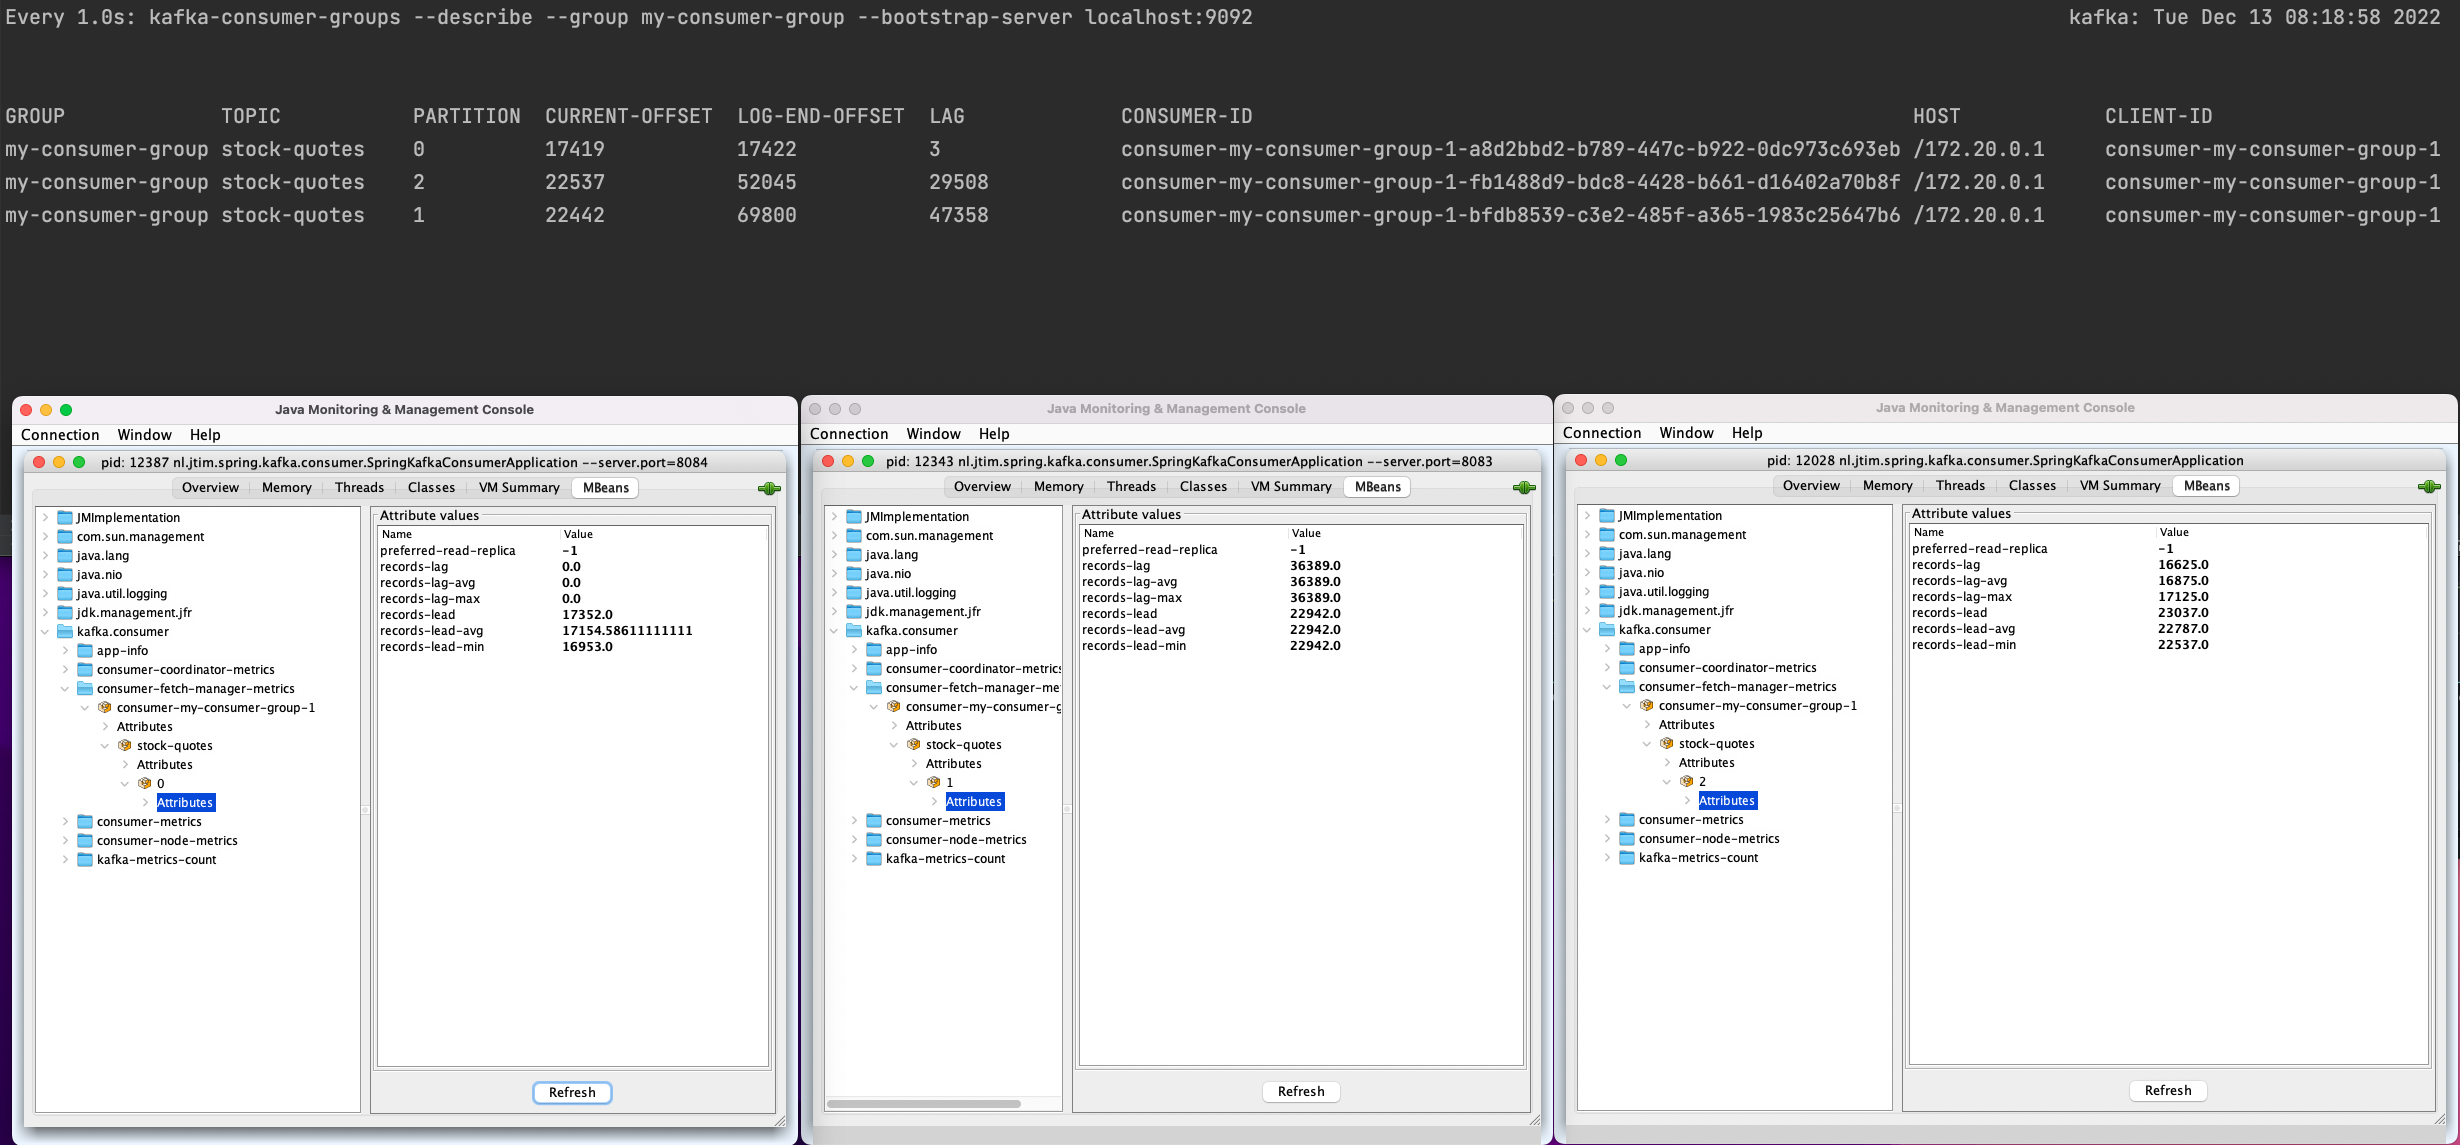
./mvnw spring-boot:run -pl spring-kafka-consumer -Dspring-boot.run.arguments=--server.port=8083./mvnw spring-boot:run -pl spring-kafka-consumer -Dspring-boot.run.arguments=--server.port=8084Also, here we see the client-side metrics are far off compared to the lag number available on the broker:
On the broker we see the lag number for all 3 partitions:
watch --interval 1 kafka-consumer-groups --describe --group my-consumer-group --bootstrap-server localhost:9092We connect via JConsole to all 3 running consumer instances to directly inspect the consumer lag metrics exposed by the Kafka client.
Run JConsole:
jconsoleYou need to open JConsole 3 times and connect to a unique consumer application.
In JConsole: Open kafa.consumer > consumer-fetch-manager-metrics > consumer-my-consumer-group-1 > stock-quotes.
We see each consumer is consuming exactly one partition.
But also here the consumer lag numbers are off compared with the consumer lag numbers on the broker (using kafka-consumer-groups command)
How can we explain the difference?
- We can explain this with the fact that the produce is running in parallel to the consumer.
- While the consumer is only aware of the progress of the last offset as far as it's most recent metadata pull - there will be differences here.
In general, the lag's metric precision should not be something critical, unlike monitoring it's trend. If the lag keeps on increasing, the consumer has a problem. While the lag's presence at a given moment is not necessarily a problem that needs action.
This way, the suggestion would be to monitor the trend. Obviously, it is, as mentioned earlier, easier to monitor the kafka-consumer-groups reported lag. However, if the only available approach is through monitoring the consumers themselves - this also is a valid approach.
To shut down everything run:
docker-compose down -v
Press ctrl + c to stop the Spring Boot application(s).
2022-12-05 13:28:31.489  INFO 49072 --- [           main] o.a.k.clients.consumer.ConsumerConfig    : ConsumerConfig values:
allow.auto.create.topics = true
auto.commit.interval.ms = 5000
auto.offset.reset = earliest
bootstrap.servers = [localhost:9092]
check.crcs = true
client.dns.lookup = use_all_dns_ips
client.id = consumer-my-consumer-group-1
client.rack =
connections.max.idle.ms = 540000
default.api.timeout.ms = 60000
enable.auto.commit = false
exclude.internal.topics = true
fetch.max.bytes = 52428800
fetch.max.wait.ms = 500
fetch.min.bytes = 1
group.id = my-consumer-group
group.instance.id = null
heartbeat.interval.ms = 3000
interceptor.classes = []
internal.leave.group.on.close = true
internal.throw.on.fetch.stable.offset.unsupported = false
isolation.level = read_uncommitted
key.deserializer = class org.apache.kafka.common.serialization.StringDeserializer
max.partition.fetch.bytes = 1048576
max.poll.interval.ms = 300000
max.poll.records = 500
metadata.max.age.ms = 300000
metric.reporters = []
metrics.num.samples = 2
metrics.recording.level = INFO
metrics.sample.window.ms = 30000
partition.assignment.strategy = [class org.apache.kafka.clients.consumer.RangeAssignor, class org.apache.kafka.clients.consumer.CooperativeStickyAssignor]
receive.buffer.bytes = 65536
reconnect.backoff.max.ms = 1000
reconnect.backoff.ms = 50
request.timeout.ms = 30000
retry.backoff.ms = 100
sasl.client.callback.handler.class = null
sasl.jaas.config = null
sasl.kerberos.kinit.cmd = /usr/bin/kinit
sasl.kerberos.min.time.before.relogin = 60000
sasl.kerberos.service.name = null
sasl.kerberos.ticket.renew.jitter = 0.05
sasl.kerberos.ticket.renew.window.factor = 0.8
sasl.login.callback.handler.class = null
sasl.login.class = null
sasl.login.connect.timeout.ms = null
sasl.login.read.timeout.ms = null
sasl.login.refresh.buffer.seconds = 300
sasl.login.refresh.min.period.seconds = 60
sasl.login.refresh.window.factor = 0.8
sasl.login.refresh.window.jitter = 0.05
sasl.login.retry.backoff.max.ms = 10000
sasl.login.retry.backoff.ms = 100
sasl.mechanism = GSSAPI
sasl.oauthbearer.clock.skew.seconds = 30
sasl.oauthbearer.expected.audience = null
sasl.oauthbearer.expected.issuer = null
sasl.oauthbearer.jwks.endpoint.refresh.ms = 3600000
sasl.oauthbearer.jwks.endpoint.retry.backoff.max.ms = 10000
sasl.oauthbearer.jwks.endpoint.retry.backoff.ms = 100
sasl.oauthbearer.jwks.endpoint.url = null
sasl.oauthbearer.scope.claim.name = scope
sasl.oauthbearer.sub.claim.name = sub
sasl.oauthbearer.token.endpoint.url = null
security.protocol = PLAINTEXT
security.providers = null
send.buffer.bytes = 131072
session.timeout.ms = 45000
socket.connection.setup.timeout.max.ms = 30000
socket.connection.setup.timeout.ms = 10000
ssl.cipher.suites = null
ssl.enabled.protocols = [TLSv1.2, TLSv1.3]
ssl.endpoint.identification.algorithm = https
ssl.engine.factory.class = null
ssl.key.password = null
ssl.keymanager.algorithm = SunX509
ssl.keystore.certificate.chain = null
ssl.keystore.key = null
ssl.keystore.location = null
ssl.keystore.password = null
ssl.keystore.type = JKS
ssl.protocol = TLSv1.3
ssl.provider = null
ssl.secure.random.implementation = null
ssl.trustmanager.algorithm = PKIX
ssl.truststore.certificates = null
ssl.truststore.location = null
ssl.truststore.password = null
ssl.truststore.type = JKS
value.deserializer = class io.confluent.kafka.serializers.KafkaAvroDeserializer
2022-12-05 13:28:31.530  INFO 49072 --- [           main] i.c.k.s.KafkaAvroDeserializerConfig      : KafkaAvroDeserializerConfig values:
auto.register.schemas = true
avro.reflection.allow.null = false
avro.use.logical.type.converters = false
basic.auth.credentials.source = URL
basic.auth.user.info = [hidden]
bearer.auth.credentials.source = STATIC_TOKEN
bearer.auth.token = [hidden]
context.name.strategy = class io.confluent.kafka.serializers.context.NullContextNameStrategy
id.compatibility.strict = true
key.subject.name.strategy = class io.confluent.kafka.serializers.subject.TopicNameStrategy
latest.compatibility.strict = true
max.schemas.per.subject = 1000
normalize.schemas = false
proxy.host =
proxy.port = -1
schema.reflection = false
schema.registry.basic.auth.user.info = [hidden]
schema.registry.ssl.cipher.suites = null
schema.registry.ssl.enabled.protocols = [TLSv1.2, TLSv1.3]
schema.registry.ssl.endpoint.identification.algorithm = https
schema.registry.ssl.engine.factory.class = null
schema.registry.ssl.key.password = null
schema.registry.ssl.keymanager.algorithm = SunX509
schema.registry.ssl.keystore.certificate.chain = null
schema.registry.ssl.keystore.key = null
schema.registry.ssl.keystore.location = null
schema.registry.ssl.keystore.password = null
schema.registry.ssl.keystore.type = JKS
schema.registry.ssl.protocol = TLSv1.3
schema.registry.ssl.provider = null
schema.registry.ssl.secure.random.implementation = null
schema.registry.ssl.trustmanager.algorithm = PKIX
schema.registry.ssl.truststore.certificates = null
schema.registry.ssl.truststore.location = null
schema.registry.ssl.truststore.password = null
schema.registry.ssl.truststore.type = JKS
schema.registry.url = [http://localhost:8081]
specific.avro.reader = true
use.latest.version = false
use.schema.id = -1
value.subject.name.strategy = class io.confluent.kafka.serializers.subject.TopicNameStrategy
