# Importing packages for analysis
import numpy as np
import pandas as pd
from datetime import datetime as dt
import matplotlib .pyplot as plt
import seaborn as sns #Importing the dataset for analysis
loan = pd .read_csv ('loan.csv' )
loan .head (5 )D:\HP\Anaconda3\envs\AI\lib\site-packages\IPython\core\interactiveshell.py:3146: DtypeWarning: Columns (47) have mixed types.Specify dtype option on import or set low_memory=False.
interactivity=interactivity, compiler=compiler, result=result)
<style scoped>
.dataframe tbody tr th:only-of-type {
vertical-align: middle;
}
.dataframe tbody tr th {
    vertical-align: top;
}

.dataframe thead th {
    text-align: right;
}
</style>
id
member_id
loan_amnt
funded_amnt
funded_amnt_inv
term
int_rate
installment
grade
sub_grade
...
num_tl_90g_dpd_24m
num_tl_op_past_12m
pct_tl_nvr_dlq
percent_bc_gt_75
pub_rec_bankruptcies
tax_liens
tot_hi_cred_lim
total_bal_ex_mort
total_bc_limit
total_il_high_credit_limit
0
1077501
1296599
5000
5000
4975.0
36 months
10.65%
162.87
B
B2
...
NaN
NaN
NaN
NaN
0.0
0.0
NaN
NaN
NaN
NaN
1
1077430
1314167
2500
2500
2500.0
60 months
15.27%
59.83
C
C4
...
NaN
NaN
NaN
NaN
0.0
0.0
NaN
NaN
NaN
NaN
2
1077175
1313524
2400
2400
2400.0
36 months
15.96%
84.33
C
C5
...
NaN
NaN
NaN
NaN
0.0
0.0
NaN
NaN
NaN
NaN
3
1076863
1277178
10000
10000
10000.0
36 months
13.49%
339.31
C
C1
...
NaN
NaN
NaN
NaN
0.0
0.0
NaN
NaN
NaN
NaN
4
1075358
1311748
3000
3000
3000.0
60 months
12.69%
67.79
B
B5
...
NaN
NaN
NaN
NaN
0.0
0.0
NaN
NaN
NaN
NaN
5 rows × 111 columns
Structure of data: Size, Shape, Data Types.. # Size of the dataframe
loan .shape # Datatypes of all the columns
pd .set_option ('display.max_columns' , 200 )
pd .set_option ('display.max_rows' , 200 )
loan .dtypes id int64
member_id int64
loan_amnt int64
funded_amnt int64
funded_amnt_inv float64
term object
int_rate object
installment float64
grade object
sub_grade object
emp_title object
emp_length object
home_ownership object
annual_inc float64
verification_status object
issue_d object
loan_status object
pymnt_plan object
url object
desc object
purpose object
title object
zip_code object
addr_state object
dti float64
delinq_2yrs int64
earliest_cr_line object
inq_last_6mths int64
mths_since_last_delinq float64
mths_since_last_record float64
open_acc int64
pub_rec int64
revol_bal int64
revol_util object
total_acc int64
initial_list_status object
out_prncp float64
out_prncp_inv float64
total_pymnt float64
total_pymnt_inv float64
total_rec_prncp float64
total_rec_int float64
total_rec_late_fee float64
recoveries float64
collection_recovery_fee float64
last_pymnt_d object
last_pymnt_amnt float64
next_pymnt_d object
last_credit_pull_d object
collections_12_mths_ex_med float64
mths_since_last_major_derog float64
policy_code int64
application_type object
annual_inc_joint float64
dti_joint float64
verification_status_joint float64
acc_now_delinq int64
tot_coll_amt float64
tot_cur_bal float64
open_acc_6m float64
open_il_6m float64
open_il_12m float64
open_il_24m float64
mths_since_rcnt_il float64
total_bal_il float64
il_util float64
open_rv_12m float64
open_rv_24m float64
max_bal_bc float64
all_util float64
total_rev_hi_lim float64
inq_fi float64
total_cu_tl float64
inq_last_12m float64
acc_open_past_24mths float64
avg_cur_bal float64
bc_open_to_buy float64
bc_util float64
chargeoff_within_12_mths float64
delinq_amnt int64
mo_sin_old_il_acct float64
mo_sin_old_rev_tl_op float64
mo_sin_rcnt_rev_tl_op float64
mo_sin_rcnt_tl float64
mort_acc float64
mths_since_recent_bc float64
mths_since_recent_bc_dlq float64
mths_since_recent_inq float64
mths_since_recent_revol_delinq float64
num_accts_ever_120_pd float64
num_actv_bc_tl float64
num_actv_rev_tl float64
num_bc_sats float64
num_bc_tl float64
num_il_tl float64
num_op_rev_tl float64
num_rev_accts float64
num_rev_tl_bal_gt_0 float64
num_sats float64
num_tl_120dpd_2m float64
num_tl_30dpd float64
num_tl_90g_dpd_24m float64
num_tl_op_past_12m float64
pct_tl_nvr_dlq float64
percent_bc_gt_75 float64
pub_rec_bankruptcies float64
tax_liens float64
tot_hi_cred_lim float64
total_bal_ex_mort float64
total_bc_limit float64
total_il_high_credit_limit float64
dtype: object
#Summary of data
loan .describe (include = 'all' )
<style scoped>
.dataframe tbody tr th:only-of-type {
vertical-align: middle;
}
.dataframe tbody tr th {
    vertical-align: top;
}

.dataframe thead th {
    text-align: right;
}
</style>
id
member_id
loan_amnt
funded_amnt
funded_amnt_inv
term
int_rate
installment
grade
sub_grade
emp_title
emp_length
home_ownership
annual_inc
verification_status
issue_d
loan_status
pymnt_plan
url
desc
purpose
title
zip_code
addr_state
dti
delinq_2yrs
earliest_cr_line
inq_last_6mths
mths_since_last_delinq
mths_since_last_record
open_acc
pub_rec
revol_bal
revol_util
total_acc
initial_list_status
out_prncp
out_prncp_inv
total_pymnt
total_pymnt_inv
total_rec_prncp
total_rec_int
total_rec_late_fee
recoveries
collection_recovery_fee
last_pymnt_d
last_pymnt_amnt
next_pymnt_d
last_credit_pull_d
collections_12_mths_ex_med
mths_since_last_major_derog
policy_code
application_type
annual_inc_joint
dti_joint
verification_status_joint
acc_now_delinq
tot_coll_amt
tot_cur_bal
open_acc_6m
open_il_6m
open_il_12m
open_il_24m
mths_since_rcnt_il
total_bal_il
il_util
open_rv_12m
open_rv_24m
max_bal_bc
all_util
total_rev_hi_lim
inq_fi
total_cu_tl
inq_last_12m
acc_open_past_24mths
avg_cur_bal
bc_open_to_buy
bc_util
chargeoff_within_12_mths
delinq_amnt
mo_sin_old_il_acct
mo_sin_old_rev_tl_op
mo_sin_rcnt_rev_tl_op
mo_sin_rcnt_tl
mort_acc
mths_since_recent_bc
mths_since_recent_bc_dlq
mths_since_recent_inq
mths_since_recent_revol_delinq
num_accts_ever_120_pd
num_actv_bc_tl
num_actv_rev_tl
num_bc_sats
num_bc_tl
num_il_tl
num_op_rev_tl
num_rev_accts
num_rev_tl_bal_gt_0
num_sats
num_tl_120dpd_2m
num_tl_30dpd
num_tl_90g_dpd_24m
num_tl_op_past_12m
pct_tl_nvr_dlq
percent_bc_gt_75
pub_rec_bankruptcies
tax_liens
tot_hi_cred_lim
total_bal_ex_mort
total_bc_limit
total_il_high_credit_limit
count
3.971700e+04
3.971700e+04
39717.000000
39717.000000
39717.000000
39717
39717
39717.000000
39717
39717
37258
38642
39717
3.971700e+04
39717
39717
39717
39717
39717
26777
39717
39706
39717
39717
39717.000000
39717.000000
39717
39717.000000
14035.000000
2786.000000
39717.000000
39717.000000
39717.000000
39667
39717.000000
39717
39717.000000
39717.000000
39717.000000
39717.000000
39717.000000
39717.000000
39717.000000
39717.000000
39717.000000
39646
39717.000000
1140
39715
39661.0
0.0
39717.0
39717
0.0
0.0
0.0
39717.0
0.0
0.0
0.0
0.0
0.0
0.0
0.0
0.0
0.0
0.0
0.0
0.0
0.0
0.0
0.0
0.0
0.0
0.0
0.0
0.0
0.0
39661.0
39717.0
0.0
0.0
0.0
0.0
0.0
0.0
0.0
0.0
0.0
0.0
0.0
0.0
0.0
0.0
0.0
0.0
0.0
0.0
0.0
0.0
0.0
0.0
0.0
0.0
0.0
39020.000000
39678.0
0.0
0.0
0.0
0.0
unique
NaN
NaN
NaN
NaN
NaN
2
371
NaN
7
35
28820
11
5
NaN
3
55
3
1
39717
26527
14
19615
823
50
NaN
NaN
526
NaN
NaN
NaN
NaN
NaN
NaN
1089
NaN
1
NaN
NaN
NaN
NaN
NaN
NaN
NaN
NaN
NaN
101
NaN
2
106
NaN
NaN
NaN
1
NaN
NaN
NaN
NaN
NaN
NaN
NaN
NaN
NaN
NaN
NaN
NaN
NaN
NaN
NaN
NaN
NaN
NaN
NaN
NaN
NaN
NaN
NaN
NaN
NaN
NaN
NaN
NaN
NaN
NaN
NaN
NaN
NaN
NaN
NaN
NaN
NaN
NaN
NaN
NaN
NaN
NaN
NaN
NaN
NaN
NaN
NaN
NaN
NaN
NaN
NaN
NaN
NaN
NaN
NaN
NaN
NaN
NaN
top
NaN
NaN
NaN
NaN
NaN
36 months
10.99%
NaN
B
B3
US Army
10+ years
RENT
NaN
Not Verified
Dec-11
Fully Paid
n
https://lendingclub.com/browse/loanDetail.acti ...debt_consolidation
Debt Consolidation
100xx
CA
NaN
NaN
Nov-98
NaN
NaN
NaN
NaN
NaN
NaN
0%
NaN
f
NaN
NaN
NaN
NaN
NaN
NaN
NaN
NaN
NaN
May-16
NaN
Jun-16
May-16
NaN
NaN
NaN
INDIVIDUAL
NaN
NaN
NaN
NaN
NaN
NaN
NaN
NaN
NaN
NaN
NaN
NaN
NaN
NaN
NaN
NaN
NaN
NaN
NaN
NaN
NaN
NaN
NaN
NaN
NaN
NaN
NaN
NaN
NaN
NaN
NaN
NaN
NaN
NaN
NaN
NaN
NaN
NaN
NaN
NaN
NaN
NaN
NaN
NaN
NaN
NaN
NaN
NaN
NaN
NaN
NaN
NaN
NaN
NaN
NaN
NaN
NaN
NaN
freq
NaN
NaN
NaN
NaN
NaN
29096
956
NaN
12020
2917
134
8879
18899
NaN
16921
2260
32950
39717
1
210
18641
2184
597
7099
NaN
NaN
370
NaN
NaN
NaN
NaN
NaN
NaN
977
NaN
39717
NaN
NaN
NaN
NaN
NaN
NaN
NaN
NaN
NaN
1256
NaN
1125
10308
NaN
NaN
NaN
39717
NaN
NaN
NaN
NaN
NaN
NaN
NaN
NaN
NaN
NaN
NaN
NaN
NaN
NaN
NaN
NaN
NaN
NaN
NaN
NaN
NaN
NaN
NaN
NaN
NaN
NaN
NaN
NaN
NaN
NaN
NaN
NaN
NaN
NaN
NaN
NaN
NaN
NaN
NaN
NaN
NaN
NaN
NaN
NaN
NaN
NaN
NaN
NaN
NaN
NaN
NaN
NaN
NaN
NaN
NaN
NaN
NaN
NaN
mean
6.831319e+05
8.504636e+05
11219.443815
10947.713196
10397.448868
NaN
NaN
324.561922
NaN
NaN
NaN
NaN
NaN
6.896893e+04
NaN
NaN
NaN
NaN
NaN
NaN
NaN
NaN
NaN
NaN
13.315130
0.146512
NaN
0.869200
35.900962
69.698134
9.294408
0.055065
13382.528086
NaN
22.088828
NaN
51.227887
50.989768
12153.596544
11567.149118
9793.348813
2263.663172
1.363015
95.221624
12.406112
NaN
2678.826162
NaN
NaN
0.0
NaN
1.0
NaN
NaN
NaN
NaN
0.0
NaN
NaN
NaN
NaN
NaN
NaN
NaN
NaN
NaN
NaN
NaN
NaN
NaN
NaN
NaN
NaN
NaN
NaN
NaN
NaN
NaN
0.0
0.0
NaN
NaN
NaN
NaN
NaN
NaN
NaN
NaN
NaN
NaN
NaN
NaN
NaN
NaN
NaN
NaN
NaN
NaN
NaN
NaN
NaN
NaN
NaN
NaN
NaN
0.043260
0.0
NaN
NaN
NaN
NaN
std
2.106941e+05
2.656783e+05
7456.670694
7187.238670
7128.450439
NaN
NaN
208.874874
NaN
NaN
NaN
NaN
NaN
6.379377e+04
NaN
NaN
NaN
NaN
NaN
NaN
NaN
NaN
NaN
NaN
6.678594
0.491812
NaN
1.070219
22.020060
43.822529
4.400282
0.237200
15885.016641
NaN
11.401709
NaN
375.172839
373.824457
9042.040766
8942.672613
7065.522127
2608.111964
7.289979
688.744771
148.671593
NaN
4447.136012
NaN
NaN
0.0
NaN
0.0
NaN
NaN
NaN
NaN
0.0
NaN
NaN
NaN
NaN
NaN
NaN
NaN
NaN
NaN
NaN
NaN
NaN
NaN
NaN
NaN
NaN
NaN
NaN
NaN
NaN
NaN
0.0
0.0
NaN
NaN
NaN
NaN
NaN
NaN
NaN
NaN
NaN
NaN
NaN
NaN
NaN
NaN
NaN
NaN
NaN
NaN
NaN
NaN
NaN
NaN
NaN
NaN
NaN
0.204324
0.0
NaN
NaN
NaN
NaN
min
5.473400e+04
7.069900e+04
500.000000
500.000000
0.000000
NaN
NaN
15.690000
NaN
NaN
NaN
NaN
NaN
4.000000e+03
NaN
NaN
NaN
NaN
NaN
NaN
NaN
NaN
NaN
NaN
0.000000
0.000000
NaN
0.000000
0.000000
0.000000
2.000000
0.000000
0.000000
NaN
2.000000
NaN
0.000000
0.000000
0.000000
0.000000
0.000000
0.000000
0.000000
0.000000
0.000000
NaN
0.000000
NaN
NaN
0.0
NaN
1.0
NaN
NaN
NaN
NaN
0.0
NaN
NaN
NaN
NaN
NaN
NaN
NaN
NaN
NaN
NaN
NaN
NaN
NaN
NaN
NaN
NaN
NaN
NaN
NaN
NaN
NaN
0.0
0.0
NaN
NaN
NaN
NaN
NaN
NaN
NaN
NaN
NaN
NaN
NaN
NaN
NaN
NaN
NaN
NaN
NaN
NaN
NaN
NaN
NaN
NaN
NaN
NaN
NaN
0.000000
0.0
NaN
NaN
NaN
NaN
25%
5.162210e+05
6.667800e+05
5500.000000
5400.000000
5000.000000
NaN
NaN
167.020000
NaN
NaN
NaN
NaN
NaN
4.040400e+04
NaN
NaN
NaN
NaN
NaN
NaN
NaN
NaN
NaN
NaN
8.170000
0.000000
NaN
0.000000
18.000000
22.000000
6.000000
0.000000
3703.000000
NaN
13.000000
NaN
0.000000
0.000000
5576.930000
5112.310000
4600.000000
662.180000
0.000000
0.000000
0.000000
NaN
218.680000
NaN
NaN
0.0
NaN
1.0
NaN
NaN
NaN
NaN
0.0
NaN
NaN
NaN
NaN
NaN
NaN
NaN
NaN
NaN
NaN
NaN
NaN
NaN
NaN
NaN
NaN
NaN
NaN
NaN
NaN
NaN
0.0
0.0
NaN
NaN
NaN
NaN
NaN
NaN
NaN
NaN
NaN
NaN
NaN
NaN
NaN
NaN
NaN
NaN
NaN
NaN
NaN
NaN
NaN
NaN
NaN
NaN
NaN
0.000000
0.0
NaN
NaN
NaN
NaN
50%
6.656650e+05
8.508120e+05
10000.000000
9600.000000
8975.000000
NaN
NaN
280.220000
NaN
NaN
NaN
NaN
NaN
5.900000e+04
NaN
NaN
NaN
NaN
NaN
NaN
NaN
NaN
NaN
NaN
13.400000
0.000000
NaN
1.000000
34.000000
90.000000
9.000000
0.000000
8850.000000
NaN
20.000000
NaN
0.000000
0.000000
9899.640319
9287.150000
8000.000000
1348.910000
0.000000
0.000000
0.000000
NaN
546.140000
NaN
NaN
0.0
NaN
1.0
NaN
NaN
NaN
NaN
0.0
NaN
NaN
NaN
NaN
NaN
NaN
NaN
NaN
NaN
NaN
NaN
NaN
NaN
NaN
NaN
NaN
NaN
NaN
NaN
NaN
NaN
0.0
0.0
NaN
NaN
NaN
NaN
NaN
NaN
NaN
NaN
NaN
NaN
NaN
NaN
NaN
NaN
NaN
NaN
NaN
NaN
NaN
NaN
NaN
NaN
NaN
NaN
NaN
0.000000
0.0
NaN
NaN
NaN
NaN
75%
8.377550e+05
1.047339e+06
15000.000000
15000.000000
14400.000000
NaN
NaN
430.780000
NaN
NaN
NaN
NaN
NaN
8.230000e+04
NaN
NaN
NaN
NaN
NaN
NaN
NaN
NaN
NaN
NaN
18.600000
0.000000
NaN
1.000000
52.000000
104.000000
12.000000
0.000000
17058.000000
NaN
29.000000
NaN
0.000000
0.000000
16534.433040
15798.810000
13653.260000
2833.400000
0.000000
0.000000
0.000000
NaN
3293.160000
NaN
NaN
0.0
NaN
1.0
NaN
NaN
NaN
NaN
0.0
NaN
NaN
NaN
NaN
NaN
NaN
NaN
NaN
NaN
NaN
NaN
NaN
NaN
NaN
NaN
NaN
NaN
NaN
NaN
NaN
NaN
0.0
0.0
NaN
NaN
NaN
NaN
NaN
NaN
NaN
NaN
NaN
NaN
NaN
NaN
NaN
NaN
NaN
NaN
NaN
NaN
NaN
NaN
NaN
NaN
NaN
NaN
NaN
0.000000
0.0
NaN
NaN
NaN
NaN
max
1.077501e+06
1.314167e+06
35000.000000
35000.000000
35000.000000
NaN
NaN
1305.190000
NaN
NaN
NaN
NaN
NaN
6.000000e+06
NaN
NaN
NaN
NaN
NaN
NaN
NaN
NaN
NaN
NaN
29.990000
11.000000
NaN
8.000000
120.000000
129.000000
44.000000
4.000000
149588.000000
NaN
90.000000
NaN
6311.470000
6307.370000
58563.679930
58563.680000
35000.020000
23563.680000
180.200000
29623.350000
7002.190000
NaN
36115.200000
NaN
NaN
0.0
NaN
1.0
NaN
NaN
NaN
NaN
0.0
NaN
NaN
NaN
NaN
NaN
NaN
NaN
NaN
NaN
NaN
NaN
NaN
NaN
NaN
NaN
NaN
NaN
NaN
NaN
NaN
NaN
0.0
0.0
NaN
NaN
NaN
NaN
NaN
NaN
NaN
NaN
NaN
NaN
NaN
NaN
NaN
NaN
NaN
NaN
NaN
NaN
NaN
NaN
NaN
NaN
NaN
NaN
NaN
2.000000
0.0
NaN
NaN
NaN
NaN
# Lets check for duplicate records in our data.
loan .drop_duplicates ()
loan .shape
# seeems like there are none. # As we are interested to figure out if a borrower is defaulter or not, the loan_status of interest is FULLY PAID and CHARGED OFF
# Lets remove all loans with statuses = "CURRENT" as its uncertain as to know if they will repay the loan or not
loan = loan .loc [loan ['loan_status' ]!= 'Current' ]
loan .shape # Percentage of null values in columns
total = pd .DataFrame (loan .isnull ().sum ().sort_values (ascending = False ), columns = ['Total' ])
percentage = pd .DataFrame (round (100 * (loan .isnull ().sum ()/ loan .shape [0 ]),2 ).sort_values (ascending = False ),columns = ['Percentage' ])
pd .concat ([total , percentage ], axis = 1 )
<style scoped>
.dataframe tbody tr th:only-of-type {
vertical-align: middle;
}
.dataframe tbody tr th {
    vertical-align: top;
}

.dataframe thead th {
    text-align: right;
}
</style>
Total
Percentage
total_il_high_credit_limit
38577
100.00
il_util
38577
100.00
bc_util
38577
100.00
bc_open_to_buy
38577
100.00
avg_cur_bal
38577
100.00
acc_open_past_24mths
38577
100.00
inq_last_12m
38577
100.00
total_cu_tl
38577
100.00
inq_fi
38577
100.00
total_rev_hi_lim
38577
100.00
all_util
38577
100.00
max_bal_bc
38577
100.00
open_rv_24m
38577
100.00
open_rv_12m
38577
100.00
total_bal_il
38577
100.00
mo_sin_old_rev_tl_op
38577
100.00
mths_since_rcnt_il
38577
100.00
open_il_24m
38577
100.00
open_il_12m
38577
100.00
open_il_6m
38577
100.00
open_acc_6m
38577
100.00
tot_cur_bal
38577
100.00
tot_coll_amt
38577
100.00
total_bc_limit
38577
100.00
dti_joint
38577
100.00
annual_inc_joint
38577
100.00
mths_since_last_major_derog
38577
100.00
next_pymnt_d
38577
100.00
mo_sin_old_il_acct
38577
100.00
verification_status_joint
38577
100.00
mo_sin_rcnt_rev_tl_op
38577
100.00
num_il_tl
38577
100.00
total_bal_ex_mort
38577
100.00
tot_hi_cred_lim
38577
100.00
percent_bc_gt_75
38577
100.00
pct_tl_nvr_dlq
38577
100.00
num_tl_90g_dpd_24m
38577
100.00
num_tl_30dpd
38577
100.00
num_tl_120dpd_2m
38577
100.00
num_sats
38577
100.00
num_rev_tl_bal_gt_0
38577
100.00
num_rev_accts
38577
100.00
num_op_rev_tl
38577
100.00
num_tl_op_past_12m
38577
100.00
num_bc_tl
38577
100.00
num_bc_sats
38577
100.00
num_actv_rev_tl
38577
100.00
num_actv_bc_tl
38577
100.00
num_accts_ever_120_pd
38577
100.00
mths_since_recent_revol_delinq
38577
100.00
mths_since_recent_inq
38577
100.00
mths_since_recent_bc_dlq
38577
100.00
mths_since_recent_bc
38577
100.00
mort_acc
38577
100.00
mo_sin_rcnt_tl
38577
100.00
mths_since_last_record
35837
92.90
mths_since_last_delinq
24905
64.56
desc
12527
32.47
emp_title
2386
6.19
emp_length
1033
2.68
pub_rec_bankruptcies
697
1.81
last_pymnt_d
71
0.18
collections_12_mths_ex_med
56
0.15
chargeoff_within_12_mths
56
0.15
revol_util
50
0.13
tax_liens
39
0.10
title
11
0.03
last_credit_pull_d
2
0.01
purpose
0
0.00
verification_status
0
0.00
url
0
0.00
pymnt_plan
0
0.00
loan_status
0
0.00
issue_d
0
0.00
loan_amnt
0
0.00
annual_inc
0
0.00
home_ownership
0
0.00
sub_grade
0
0.00
grade
0
0.00
installment
0
0.00
int_rate
0
0.00
term
0
0.00
funded_amnt_inv
0
0.00
funded_amnt
0
0.00
addr_state
0
0.00
member_id
0
0.00
zip_code
0
0.00
total_rec_prncp
0
0.00
dti
0
0.00
total_pymnt_inv
0
0.00
acc_now_delinq
0
0.00
application_type
0
0.00
policy_code
0
0.00
last_pymnt_amnt
0
0.00
collection_recovery_fee
0
0.00
recoveries
0
0.00
total_rec_late_fee
0
0.00
total_rec_int
0
0.00
delinq_amnt
0
0.00
total_pymnt
0
0.00
delinq_2yrs
0
0.00
out_prncp_inv
0
0.00
out_prncp
0
0.00
initial_list_status
0
0.00
total_acc
0
0.00
revol_bal
0
0.00
pub_rec
0
0.00
open_acc
0
0.00
inq_last_6mths
0
0.00
earliest_cr_line
0
0.00
id
0
0.00
# Dropping all columns with only null values
loan = loan .dropna (axis = 1 ,how = 'all' )
loan .shape Checkout some of the categorical variables array(['10+ years', '< 1 year', '3 years', '8 years', '9 years',
'4 years', '5 years', '1 year', '6 years', '2 years', '7 years',
nan], dtype=object)
loan .collections_12_mths_ex_med .unique ()loan .chargeoff_within_12_mths .unique ()loan .pub_rec_bankruptcies .unique ()array([ 0., 1., 2., nan])
The columns collections_12_mths_ex_med, chargeoff_within_12_mths and tax_liens has either value of 0 or nan. The range of values that these categorical columns can take is not of any significant impact to the analysis. We can decide to drop these columns for analysis. # Removing columns that is not of interest for our analysis along with columns that has many null values
drop_columns = ['desc' ,'title' ,'url' ,'mths_since_last_record' ,'mths_since_last_delinq' ,'collections_12_mths_ex_med' ,
'last_pymnt_d' ,'revol_util' ,'collections_12_mths_ex_med' ,'chargeoff_within_12_mths' ,'tax_liens' ,
'pymnt_plan' ,'zip_code' ,'initial_list_status' ,'policy_code' ,'application_type' ,'acc_now_delinq' ,'delinq_amnt' ,]
loan = loan .drop (drop_columns , axis = 1 )
loan .shape # Percentage of null values in columns
total = pd .DataFrame (loan .isnull ().sum ().sort_values (ascending = False ), columns = ['Total' ])
percentage = pd .DataFrame (round (100 * (loan .isnull ().sum ()/ loan .shape [0 ]),2 ).sort_values (ascending = False ),columns = ['Percentage' ])
pd .concat ([total , percentage ], axis = 1 )
<style scoped>
.dataframe tbody tr th:only-of-type {
vertical-align: middle;
}
.dataframe tbody tr th {
    vertical-align: top;
}

.dataframe thead th {
    text-align: right;
}
</style>
Total
Percentage
emp_title
2386
6.19
emp_length
1033
2.68
pub_rec_bankruptcies
697
1.81
last_credit_pull_d
2
0.01
funded_amnt
0
0.00
funded_amnt_inv
0
0.00
term
0
0.00
int_rate
0
0.00
installment
0
0.00
grade
0
0.00
addr_state
0
0.00
loan_amnt
0
0.00
member_id
0
0.00
home_ownership
0
0.00
annual_inc
0
0.00
verification_status
0
0.00
issue_d
0
0.00
loan_status
0
0.00
purpose
0
0.00
sub_grade
0
0.00
dti
0
0.00
delinq_2yrs
0
0.00
earliest_cr_line
0
0.00
last_pymnt_amnt
0
0.00
collection_recovery_fee
0
0.00
recoveries
0
0.00
total_rec_late_fee
0
0.00
total_rec_int
0
0.00
total_rec_prncp
0
0.00
total_pymnt_inv
0
0.00
total_pymnt
0
0.00
out_prncp_inv
0
0.00
out_prncp
0
0.00
total_acc
0
0.00
revol_bal
0
0.00
pub_rec
0
0.00
open_acc
0
0.00
inq_last_6mths
0
0.00
id
0
0.00
The columns emp_title, emp_length and pub_rec_bankruptcies have 6.19%, 2.68% and 1.81% missing value respectively. These columns have information about the customer/borrower like their job title and their employment length in years.Lets treat the missing value as it is for our analysis as we do not want to add bias to data by imputing #loan=loan[~loan.emp_title.isnull()]
#loan=loan[~loan.emp_length.isnull()]
#loan=loan[~loan.pub_rec_bankruptcies.isnull()] # Percentage of null values in columns
total = pd .DataFrame (loan .isnull ().sum ().sort_values (ascending = False ), columns = ['Total' ])
percentage = pd .DataFrame (round (100 * (loan .isnull ().sum ()/ loan .shape [0 ]),2 ).sort_values (ascending = False ),columns = ['Percentage' ])
pd .concat ([total , percentage ], axis = 1 )
<style scoped>
.dataframe tbody tr th:only-of-type {
vertical-align: middle;
}
.dataframe tbody tr th {
    vertical-align: top;
}

.dataframe thead th {
    text-align: right;
}
</style>
Total
Percentage
emp_title
2386
6.19
emp_length
1033
2.68
pub_rec_bankruptcies
697
1.81
last_credit_pull_d
2
0.01
funded_amnt
0
0.00
funded_amnt_inv
0
0.00
term
0
0.00
int_rate
0
0.00
installment
0
0.00
grade
0
0.00
addr_state
0
0.00
loan_amnt
0
0.00
member_id
0
0.00
home_ownership
0
0.00
annual_inc
0
0.00
verification_status
0
0.00
issue_d
0
0.00
loan_status
0
0.00
purpose
0
0.00
sub_grade
0
0.00
dti
0
0.00
delinq_2yrs
0
0.00
earliest_cr_line
0
0.00
last_pymnt_amnt
0
0.00
collection_recovery_fee
0
0.00
recoveries
0
0.00
total_rec_late_fee
0
0.00
total_rec_int
0
0.00
total_rec_prncp
0
0.00
total_pymnt_inv
0
0.00
total_pymnt
0
0.00
out_prncp_inv
0
0.00
out_prncp
0
0.00
total_acc
0
0.00
revol_bal
0
0.00
pub_rec
0
0.00
open_acc
0
0.00
inq_last_6mths
0
0.00
id
0
0.00
#Standardise columns
loan .int_rate = loan .int_rate .apply (lambda x : x [:- 1 ]).astype ('float64' )#Lets have two columns 'Charged Off' and 'Fully Paid'
# Based on Loan status CHARGED_OFF column will have the value 1 if Loan status = 'Charged Off', else 0
# and FULLY_PAID column will have the value 1 if Loan status = 'Fully Paid', else 0
loan ['fully_paid' ] = loan ['loan_status' ].apply (lambda x : 1 if x == 'Fully Paid' else 0 )
loan ['charged_off' ] = loan ['loan_status' ].apply (lambda x : 1 if x == 'Charged Off' else 0 )
loan
<style scoped>
.dataframe tbody tr th:only-of-type {
vertical-align: middle;
}
.dataframe tbody tr th {
    vertical-align: top;
}

.dataframe thead th {
    text-align: right;
}
</style>
id
member_id
loan_amnt
funded_amnt
funded_amnt_inv
term
int_rate
installment
grade
sub_grade
emp_title
emp_length
home_ownership
annual_inc
verification_status
issue_d
loan_status
purpose
addr_state
dti
delinq_2yrs
earliest_cr_line
inq_last_6mths
open_acc
pub_rec
revol_bal
total_acc
out_prncp
out_prncp_inv
total_pymnt
total_pymnt_inv
total_rec_prncp
total_rec_int
total_rec_late_fee
recoveries
collection_recovery_fee
last_pymnt_amnt
last_credit_pull_d
pub_rec_bankruptcies
fully_paid
charged_off
0
1077501
1296599
5000
5000
4975.0
36 months
10.65
162.87
B
B2
NaN
10+ years
RENT
24000.0
Verified
Dec-11
Fully Paid
credit_card
AZ
27.65
0
Jan-85
1
3
0
13648
9
0.0
0.0
5863.155187
5833.84
5000.00
863.16
0.00
0.00
0.00
171.62
May-16
0.0
1
0
1
1077430
1314167
2500
2500
2500.0
60 months
15.27
59.83
C
C4
Ryder
< 1 year
RENT
30000.0
Source Verified
Dec-11
Charged Off
car
GA
1.00
0
Apr-99
5
3
0
1687
4
0.0
0.0
1008.710000
1008.71
456.46
435.17
0.00
117.08
1.11
119.66
Sep-13
0.0
0
1
2
1077175
1313524
2400
2400
2400.0
36 months
15.96
84.33
C
C5
NaN
10+ years
RENT
12252.0
Not Verified
Dec-11
Fully Paid
small_business
IL
8.72
0
Nov-01
2
2
0
2956
10
0.0
0.0
3005.666844
3005.67
2400.00
605.67
0.00
0.00
0.00
649.91
May-16
0.0
1
0
3
1076863
1277178
10000
10000
10000.0
36 months
13.49
339.31
C
C1
AIR RESOURCES BOARD
10+ years
RENT
49200.0
Source Verified
Dec-11
Fully Paid
other
CA
20.00
0
Feb-96
1
10
0
5598
37
0.0
0.0
12231.890000
12231.89
10000.00
2214.92
16.97
0.00
0.00
357.48
Apr-16
0.0
1
0
5
1075269
1311441
5000
5000
5000.0
36 months
7.90
156.46
A
A4
Veolia Transportaton
3 years
RENT
36000.0
Source Verified
Dec-11
Fully Paid
wedding
AZ
11.20
0
Nov-04
3
9
0
7963
12
0.0
0.0
5632.210000
5632.21
5000.00
632.21
0.00
0.00
0.00
161.03
Jan-16
0.0
1
0
...
...
...
...
...
...
...
...
...
...
...
...
...
...
...
...
...
...
...
...
...
...
...
...
...
...
...
...
...
...
...
...
...
...
...
...
...
...
...
...
...
...
39712
92187
92174
2500
2500
1075.0
36 months
8.07
78.42
A
A4
FiSite Research
4 years
MORTGAGE
110000.0
Not Verified
Jul-07
Fully Paid
home_improvement
CO
11.33
0
Nov-90
0
13
0
7274
40
0.0
0.0
2822.969293
1213.88
2500.00
322.97
0.00
0.00
0.00
80.90
Jun-10
NaN
1
0
39713
90665
90607
8500
8500
875.0
36 months
10.28
275.38
C
C1
Squarewave Solutions, Ltd.
3 years
RENT
18000.0
Not Verified
Jul-07
Fully Paid
credit_card
NC
6.40
1
Dec-86
1
6
0
8847
9
0.0
0.0
9913.491822
1020.51
8500.00
1413.49
0.00
0.00
0.00
281.94
Jul-10
NaN
1
0
39714
90395
90390
5000
5000
1325.0
36 months
8.07
156.84
A
A4
NaN
< 1 year
MORTGAGE
100000.0
Not Verified
Jul-07
Fully Paid
debt_consolidation
MA
2.30
0
Oct-98
0
11
0
9698
20
0.0
0.0
5272.161128
1397.12
5000.00
272.16
0.00
0.00
0.00
0.00
Jun-07
NaN
1
0
39715
90376
89243
5000
5000
650.0
36 months
7.43
155.38
A
A2
NaN
< 1 year
MORTGAGE
200000.0
Not Verified
Jul-07
Fully Paid
other
MD
3.72
0
Nov-88
0
17
0
85607
26
0.0
0.0
5174.198551
672.66
5000.00
174.20
0.00
0.00
0.00
0.00
Jun-07
NaN
1
0
39716
87023
86999
7500
7500
800.0
36 months
13.75
255.43
E
E2
Evergreen Center
< 1 year
OWN
22000.0
Not Verified
Jun-07
Fully Paid
debt_consolidation
MA
14.29
1
Oct-03
0
7
0
4175
8
0.0
0.0
9195.263334
980.83
7500.00
1695.26
0.00
0.00
0.00
256.59
Jun-10
NaN
1
0
38577 rows × 41 columns
#emp_lenght is a categorical variable and the values are as such seems to be fine and self explanatory
#As their value doesnt affect the analysis we need not modify it and lets make use of it as it is
loan .emp_length .value_counts ()10+ years 8488
< 1 year 4508
2 years 4291
3 years 4012
4 years 3342
5 years 3194
1 year 3169
6 years 2168
7 years 1711
8 years 1435
9 years 1226
Name: emp_length, dtype: int64
#Converting the dtype of issue date to datetime
loan .issue_d = pd .to_datetime (loan .issue_d , format = '%b-%y' )
loan .issue_d 0 2011-12-01
1 2011-12-01
2 2011-12-01
3 2011-12-01
5 2011-12-01
...
39712 2007-07-01
39713 2007-07-01
39714 2007-07-01
39715 2007-07-01
39716 2007-06-01
Name: issue_d, Length: 38577, dtype: datetime64[ns]
#split the available date into month and year column
loan ['issue_d_month' ] = loan ['issue_d' ].dt .month
loan ['issue_d_year' ] = loan ['issue_d' ].dt .year
<style scoped>
.dataframe tbody tr th:only-of-type {
vertical-align: middle;
}
.dataframe tbody tr th {
    vertical-align: top;
}

.dataframe thead th {
    text-align: right;
}
</style>
id
member_id
loan_amnt
funded_amnt
funded_amnt_inv
term
int_rate
installment
grade
sub_grade
emp_title
emp_length
home_ownership
annual_inc
verification_status
issue_d
loan_status
purpose
addr_state
dti
delinq_2yrs
earliest_cr_line
inq_last_6mths
open_acc
pub_rec
revol_bal
total_acc
out_prncp
out_prncp_inv
total_pymnt
total_pymnt_inv
total_rec_prncp
total_rec_int
total_rec_late_fee
recoveries
collection_recovery_fee
last_pymnt_amnt
last_credit_pull_d
pub_rec_bankruptcies
fully_paid
charged_off
issue_d_month
issue_d_year
0
1077501
1296599
5000
5000
4975.0
36 months
10.65
162.87
B
B2
NaN
10+ years
RENT
24000.0
Verified
2011-12-01
Fully Paid
credit_card
AZ
27.65
0
Jan-85
1
3
0
13648
9
0.0
0.0
5863.155187
5833.84
5000.00
863.16
0.00
0.00
0.00
171.62
May-16
0.0
1
0
12
2011
1
1077430
1314167
2500
2500
2500.0
60 months
15.27
59.83
C
C4
Ryder
< 1 year
RENT
30000.0
Source Verified
2011-12-01
Charged Off
car
GA
1.00
0
Apr-99
5
3
0
1687
4
0.0
0.0
1008.710000
1008.71
456.46
435.17
0.00
117.08
1.11
119.66
Sep-13
0.0
0
1
12
2011
2
1077175
1313524
2400
2400
2400.0
36 months
15.96
84.33
C
C5
NaN
10+ years
RENT
12252.0
Not Verified
2011-12-01
Fully Paid
small_business
IL
8.72
0
Nov-01
2
2
0
2956
10
0.0
0.0
3005.666844
3005.67
2400.00
605.67
0.00
0.00
0.00
649.91
May-16
0.0
1
0
12
2011
3
1076863
1277178
10000
10000
10000.0
36 months
13.49
339.31
C
C1
AIR RESOURCES BOARD
10+ years
RENT
49200.0
Source Verified
2011-12-01
Fully Paid
other
CA
20.00
0
Feb-96
1
10
0
5598
37
0.0
0.0
12231.890000
12231.89
10000.00
2214.92
16.97
0.00
0.00
357.48
Apr-16
0.0
1
0
12
2011
5
1075269
1311441
5000
5000
5000.0
36 months
7.90
156.46
A
A4
Veolia Transportaton
3 years
RENT
36000.0
Source Verified
2011-12-01
Fully Paid
wedding
AZ
11.20
0
Nov-04
3
9
0
7963
12
0.0
0.0
5632.210000
5632.21
5000.00
632.21
0.00
0.00
0.00
161.03
Jan-16
0.0
1
0
12
2011
...
...
...
...
...
...
...
...
...
...
...
...
...
...
...
...
...
...
...
...
...
...
...
...
...
...
...
...
...
...
...
...
...
...
...
...
...
...
...
...
...
...
...
...
39712
92187
92174
2500
2500
1075.0
36 months
8.07
78.42
A
A4
FiSite Research
4 years
MORTGAGE
110000.0
Not Verified
2007-07-01
Fully Paid
home_improvement
CO
11.33
0
Nov-90
0
13
0
7274
40
0.0
0.0
2822.969293
1213.88
2500.00
322.97
0.00
0.00
0.00
80.90
Jun-10
NaN
1
0
7
2007
39713
90665
90607
8500
8500
875.0
36 months
10.28
275.38
C
C1
Squarewave Solutions, Ltd.
3 years
RENT
18000.0
Not Verified
2007-07-01
Fully Paid
credit_card
NC
6.40
1
Dec-86
1
6
0
8847
9
0.0
0.0
9913.491822
1020.51
8500.00
1413.49
0.00
0.00
0.00
281.94
Jul-10
NaN
1
0
7
2007
39714
90395
90390
5000
5000
1325.0
36 months
8.07
156.84
A
A4
NaN
< 1 year
MORTGAGE
100000.0
Not Verified
2007-07-01
Fully Paid
debt_consolidation
MA
2.30
0
Oct-98
0
11
0
9698
20
0.0
0.0
5272.161128
1397.12
5000.00
272.16
0.00
0.00
0.00
0.00
Jun-07
NaN
1
0
7
2007
39715
90376
89243
5000
5000
650.0
36 months
7.43
155.38
A
A2
NaN
< 1 year
MORTGAGE
200000.0
Not Verified
2007-07-01
Fully Paid
other
MD
3.72
0
Nov-88
0
17
0
85607
26
0.0
0.0
5174.198551
672.66
5000.00
174.20
0.00
0.00
0.00
0.00
Jun-07
NaN
1
0
7
2007
39716
87023
86999
7500
7500
800.0
36 months
13.75
255.43
E
E2
Evergreen Center
< 1 year
OWN
22000.0
Not Verified
2007-06-01
Fully Paid
debt_consolidation
MA
14.29
1
Oct-03
0
7
0
4175
8
0.0
0.0
9195.263334
980.83
7500.00
1695.26
0.00
0.00
0.00
256.59
Jun-10
NaN
1
0
6
2007
38577 rows × 43 columns
Derived Metrics for our analysis count 38577.000000
mean 11.932219
std 3.691327
min 5.420000
25% 8.940000
50% 11.710000
75% 14.380000
max 24.400000
Name: int_rate, dtype: float64
# Binning the interest rates into different slots
def interest_rate_slot (loan ,cut_points ,label_names ):
column_index = loan .columns .get_loc ('int_rate' ) + 1
loan .insert (loc = column_index ,column = 'interest_rate_bins' ,value = pd .cut (loan ['int_rate' ],cut_points ,labels = label_names , include_lowest = True ))
return loan
cut_points = [5 ,10 ,15 ,25 ]
label_names = ["Low" ,"Medium" ,"High" ]
loan = interest_rate_slot (loan ,cut_points ,label_names )
loan .head ()
<style scoped>
.dataframe tbody tr th:only-of-type {
vertical-align: middle;
}
.dataframe tbody tr th {
    vertical-align: top;
}

.dataframe thead th {
    text-align: right;
}
</style>
id
member_id
loan_amnt
funded_amnt
funded_amnt_inv
term
int_rate
interest_rate_bins
installment
grade
sub_grade
emp_title
emp_length
home_ownership
annual_inc
verification_status
issue_d
loan_status
purpose
addr_state
dti
delinq_2yrs
earliest_cr_line
inq_last_6mths
open_acc
pub_rec
revol_bal
total_acc
out_prncp
out_prncp_inv
total_pymnt
total_pymnt_inv
total_rec_prncp
total_rec_int
total_rec_late_fee
recoveries
collection_recovery_fee
last_pymnt_amnt
last_credit_pull_d
pub_rec_bankruptcies
fully_paid
charged_off
issue_d_month
issue_d_year
0
1077501
1296599
5000
5000
4975.0
36 months
10.65
Medium
162.87
B
B2
NaN
10+ years
RENT
24000.0
Verified
2011-12-01
Fully Paid
credit_card
AZ
27.65
0
Jan-85
1
3
0
13648
9
0.0
0.0
5863.155187
5833.84
5000.00
863.16
0.00
0.00
0.00
171.62
May-16
0.0
1
0
12
2011
1
1077430
1314167
2500
2500
2500.0
60 months
15.27
High
59.83
C
C4
Ryder
< 1 year
RENT
30000.0
Source Verified
2011-12-01
Charged Off
car
GA
1.00
0
Apr-99
5
3
0
1687
4
0.0
0.0
1008.710000
1008.71
456.46
435.17
0.00
117.08
1.11
119.66
Sep-13
0.0
0
1
12
2011
2
1077175
1313524
2400
2400
2400.0
36 months
15.96
High
84.33
C
C5
NaN
10+ years
RENT
12252.0
Not Verified
2011-12-01
Fully Paid
small_business
IL
8.72
0
Nov-01
2
2
0
2956
10
0.0
0.0
3005.666844
3005.67
2400.00
605.67
0.00
0.00
0.00
649.91
May-16
0.0
1
0
12
2011
3
1076863
1277178
10000
10000
10000.0
36 months
13.49
Medium
339.31
C
C1
AIR RESOURCES BOARD
10+ years
RENT
49200.0
Source Verified
2011-12-01
Fully Paid
other
CA
20.00
0
Feb-96
1
10
0
5598
37
0.0
0.0
12231.890000
12231.89
10000.00
2214.92
16.97
0.00
0.00
357.48
Apr-16
0.0
1
0
12
2011
5
1075269
1311441
5000
5000
5000.0
36 months
7.90
Low
156.46
A
A4
Veolia Transportaton
3 years
RENT
36000.0
Source Verified
2011-12-01
Fully Paid
wedding
AZ
11.20
0
Nov-04
3
9
0
7963
12
0.0
0.0
5632.210000
5632.21
5000.00
632.21
0.00
0.00
0.00
161.03
Jan-16
0.0
1
0
12
2011
# Binning the dti values
def dti_slot (loan ,cut_points ,label_names ):
column_index = loan .columns .get_loc ('dti' ) + 1
loan .insert (loc = column_index ,column = 'dti_bins' ,value = pd .cut (loan ['dti' ],cut_points ,labels = label_names , include_lowest = True ))
return loan
cut_points = [0 ,5 ,10 ,15 ,20 ,25 ,30 ]
label_names = ["Less Than 5" ,"Btwn 5 & 10" ,"Btwn 10 & 15" ,"Btwn 15 & 20" ,"Btwn 20 & 25" ,"Btwn 25 & 30" ]
loan = dti_slot (loan ,cut_points ,label_names )
loan .head ()
<style scoped>
.dataframe tbody tr th:only-of-type {
vertical-align: middle;
}
.dataframe tbody tr th {
    vertical-align: top;
}

.dataframe thead th {
    text-align: right;
}
</style>
id
member_id
loan_amnt
funded_amnt
funded_amnt_inv
term
int_rate
interest_rate_bins
installment
grade
sub_grade
emp_title
emp_length
home_ownership
annual_inc
verification_status
issue_d
loan_status
purpose
addr_state
dti
dti_bins
delinq_2yrs
earliest_cr_line
inq_last_6mths
open_acc
pub_rec
revol_bal
total_acc
out_prncp
out_prncp_inv
total_pymnt
total_pymnt_inv
total_rec_prncp
total_rec_int
total_rec_late_fee
recoveries
collection_recovery_fee
last_pymnt_amnt
last_credit_pull_d
pub_rec_bankruptcies
fully_paid
charged_off
issue_d_month
issue_d_year
0
1077501
1296599
5000
5000
4975.0
36 months
10.65
Medium
162.87
B
B2
NaN
10+ years
RENT
24000.0
Verified
2011-12-01
Fully Paid
credit_card
AZ
27.65
Btwn 25 & 30
0
Jan-85
1
3
0
13648
9
0.0
0.0
5863.155187
5833.84
5000.00
863.16
0.00
0.00
0.00
171.62
May-16
0.0
1
0
12
2011
1
1077430
1314167
2500
2500
2500.0
60 months
15.27
High
59.83
C
C4
Ryder
< 1 year
RENT
30000.0
Source Verified
2011-12-01
Charged Off
car
GA
1.00
Less Than 5
0
Apr-99
5
3
0
1687
4
0.0
0.0
1008.710000
1008.71
456.46
435.17
0.00
117.08
1.11
119.66
Sep-13
0.0
0
1
12
2011
2
1077175
1313524
2400
2400
2400.0
36 months
15.96
High
84.33
C
C5
NaN
10+ years
RENT
12252.0
Not Verified
2011-12-01
Fully Paid
small_business
IL
8.72
Btwn 5 & 10
0
Nov-01
2
2
0
2956
10
0.0
0.0
3005.666844
3005.67
2400.00
605.67
0.00
0.00
0.00
649.91
May-16
0.0
1
0
12
2011
3
1076863
1277178
10000
10000
10000.0
36 months
13.49
Medium
339.31
C
C1
AIR RESOURCES BOARD
10+ years
RENT
49200.0
Source Verified
2011-12-01
Fully Paid
other
CA
20.00
Btwn 15 & 20
0
Feb-96
1
10
0
5598
37
0.0
0.0
12231.890000
12231.89
10000.00
2214.92
16.97
0.00
0.00
357.48
Apr-16
0.0
1
0
12
2011
5
1075269
1311441
5000
5000
5000.0
36 months
7.90
Low
156.46
A
A4
Veolia Transportaton
3 years
RENT
36000.0
Source Verified
2011-12-01
Fully Paid
wedding
AZ
11.20
Btwn 10 & 15
0
Nov-04
3
9
0
7963
12
0.0
0.0
5632.210000
5632.21
5000.00
632.21
0.00
0.00
0.00
161.03
Jan-16
0.0
1
0
12
2011
...
...
...
...
...
...
...
...
...
...
...
...
...
...
...
...
...
...
...
...
...
...
...
...
...
...
...
...
...
...
...
...
...
...
...
...
...
...
...
...
...
...
...
...
...
...
39712
92187
92174
2500
2500
1075.0
36 months
8.07
Low
78.42
A
A4
FiSite Research
4 years
MORTGAGE
110000.0
Not Verified
2007-07-01
Fully Paid
home_improvement
CO
11.33
Btwn 10 & 15
0
Nov-90
0
13
0
7274
40
0.0
0.0
2822.969293
1213.88
2500.00
322.97
0.00
0.00
0.00
80.90
Jun-10
NaN
1
0
7
2007
39713
90665
90607
8500
8500
875.0
36 months
10.28
Medium
275.38
C
C1
Squarewave Solutions, Ltd.
3 years
RENT
18000.0
Not Verified
2007-07-01
Fully Paid
credit_card
NC
6.40
Btwn 5 & 10
1
Dec-86
1
6
0
8847
9
0.0
0.0
9913.491822
1020.51
8500.00
1413.49
0.00
0.00
0.00
281.94
Jul-10
NaN
1
0
7
2007
39714
90395
90390
5000
5000
1325.0
36 months
8.07
Low
156.84
A
A4
NaN
< 1 year
MORTGAGE
100000.0
Not Verified
2007-07-01
Fully Paid
debt_consolidation
MA
2.30
Less Than 5
0
Oct-98
0
11
0
9698
20
0.0
0.0
5272.161128
1397.12
5000.00
272.16
0.00
0.00
0.00
0.00
Jun-07
NaN
1
0
7
2007
39715
90376
89243
5000
5000
650.0
36 months
7.43
Low
155.38
A
A2
NaN
< 1 year
MORTGAGE
200000.0
Not Verified
2007-07-01
Fully Paid
other
MD
3.72
Less Than 5
0
Nov-88
0
17
0
85607
26
0.0
0.0
5174.198551
672.66
5000.00
174.20
0.00
0.00
0.00
0.00
Jun-07
NaN
1
0
7
2007
39716
87023
86999
7500
7500
800.0
36 months
13.75
Medium
255.43
E
E2
Evergreen Center
< 1 year
OWN
22000.0
Not Verified
2007-06-01
Fully Paid
debt_consolidation
MA
14.29
Btwn 10 & 15
1
Oct-03
0
7
0
4175
8
0.0
0.0
9195.263334
980.83
7500.00
1695.26
0.00
0.00
0.00
256.59
Jun-10
NaN
1
0
6
2007
38577 rows × 45 columns
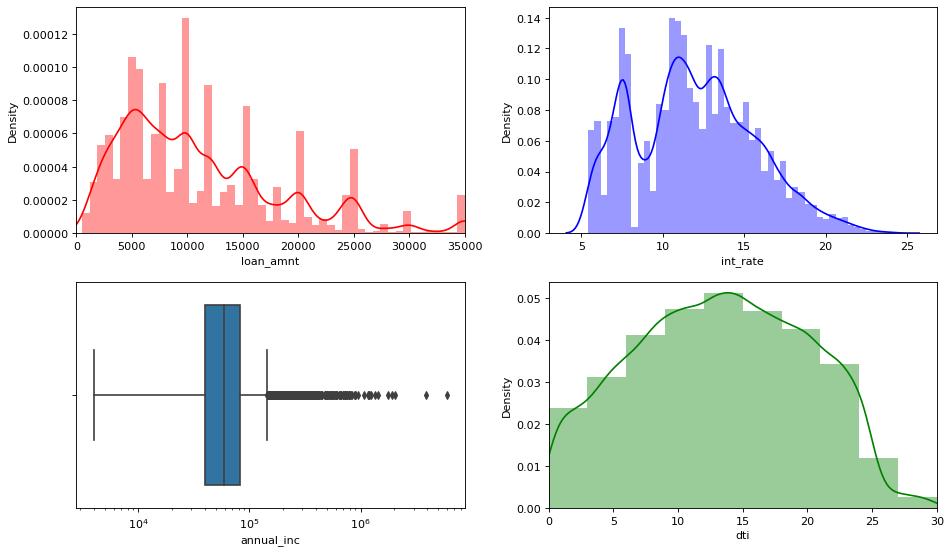
Lets us observe some general trend in Loans based on factors such as loan amounts, interest rates, annual income and dti #charged_off = loan.loc[loan['loan_status']=='Charged Off']
plt .figure (figsize = (12 , 10 ), dpi = 80 , facecolor = 'w' , edgecolor = 'k' )
# subplot 1: loan_amnt
plt .subplot (3 , 2 , 1 )
sns .distplot (loan ['loan_amnt' ], color = 'red' )
plt .xlim ([0 , 35000 ])
# subplot 2: int_rate
plt .subplot (3 , 2 , 2 )
sns .distplot (loan ['int_rate' ], color = 'blue' )
# subplot 3: annual_inc
plt .subplot (3 , 2 , 3 )
plt .xscale ('log' )
sns .boxplot ('annual_inc' , data = loan )
# subplot 4: dti
plt .subplot (3 , 2 , 4 )
sns .distplot (loan ['dti' ], color = 'green' , bins = 10 )
plt .xlim ([0 , 30 ])
plt .tight_layout ()
plt .show ()D:\HP\Anaconda3\envs\AI\lib\site-packages\seaborn\distributions.py:2551: FutureWarning: `distplot` is a deprecated function and will be removed in a future version. Please adapt your code to use either `displot` (a figure-level function with similar flexibility) or `histplot` (an axes-level function for histograms).
warnings.warn(msg, FutureWarning)
D:\HP\Anaconda3\envs\AI\lib\site-packages\seaborn\distributions.py:2551: FutureWarning: `distplot` is a deprecated function and will be removed in a future version. Please adapt your code to use either `displot` (a figure-level function with similar flexibility) or `histplot` (an axes-level function for histograms).
warnings.warn(msg, FutureWarning)
D:\HP\Anaconda3\envs\AI\lib\site-packages\seaborn\_decorators.py:43: FutureWarning: Pass the following variable as a keyword arg: x. From version 0.12, the only valid positional argument will be `data`, and passing other arguments without an explicit keyword will result in an error or misinterpretation.
FutureWarning
D:\HP\Anaconda3\envs\AI\lib\site-packages\seaborn\distributions.py:2551: FutureWarning: `distplot` is a deprecated function and will be removed in a future version. Please adapt your code to use either `displot` (a figure-level function with similar flexibility) or `histplot` (an axes-level function for histograms).
warnings.warn(msg, FutureWarning)
We can see that most of the loans are in the range of 2000 to 16000.
Most Loan interest rates are in between 5% to 10% and 10% to 15%, the trend decreases after 15.
The frequency distribution of dti seems to be symmetric in nature centered around 15.
There are quite a few top outlier values in annual income of borrowers.
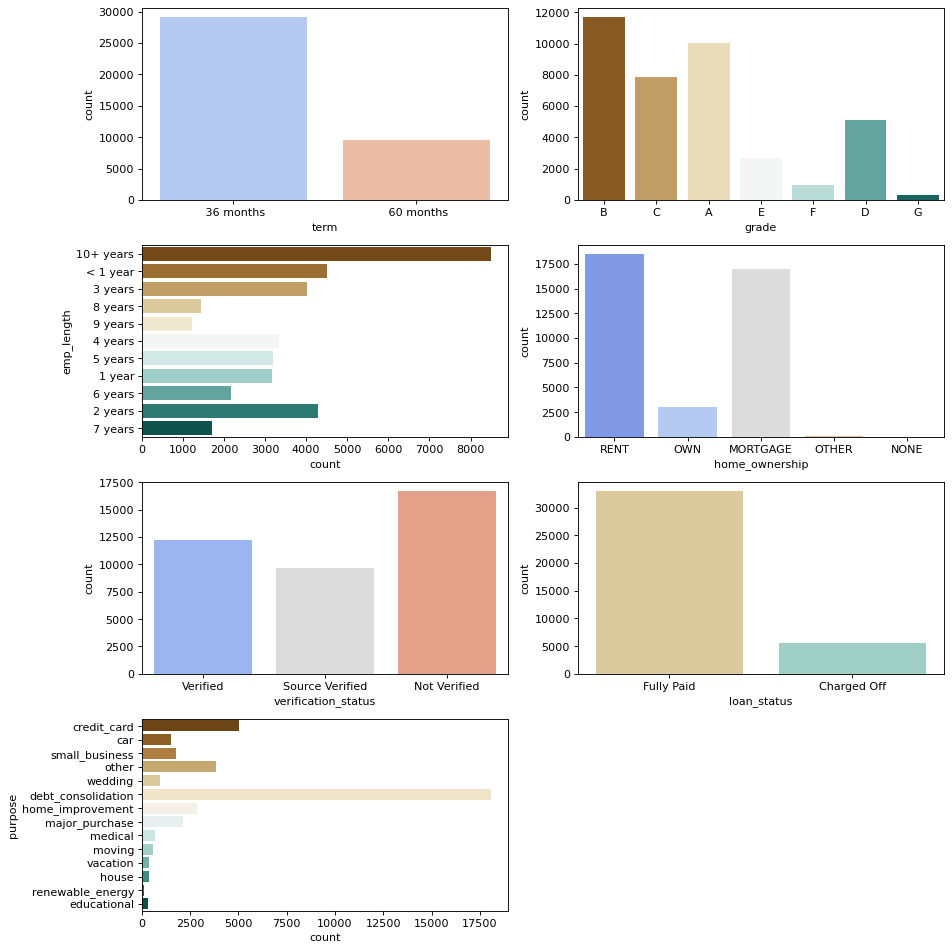
Some more Insights based on factors like loan terms, grades, employess lengths, home ownerships, loan verification status, loan purpose and derogatory public records` plt .figure (figsize = (12 , 12 ), dpi = 80 , facecolor = 'w' , edgecolor = 'k' )
# subplot 1: Terms
plt .subplot (4 , 2 , 1 )
sns .countplot (x = 'term' , palette = 'coolwarm' , data = loan )
# subplot 2: Grade
plt .subplot (4 , 2 , 2 )
sns .countplot (x = 'grade' , palette = 'BrBG' , data = loan )
# subplot 3: Emp_length
plt .subplot (4 , 2 , 3 )
sns .countplot (y = 'emp_length' , palette = 'BrBG' , data = loan )
# subplot 4: home_ownership
plt .subplot (4 , 2 , 4 )
sns .countplot (x = 'home_ownership' , palette = 'coolwarm' , data = loan )
# subplot 5: verification_status
plt .subplot (4 , 2 , 5 )
sns .countplot (x = 'verification_status' , palette = 'coolwarm' , data = loan )
# subplot 6: loan_status
plt .subplot (4 , 2 , 6 )
sns .countplot (x = 'loan_status' , palette = 'BrBG' , data = loan )
# subplot 7: purpose
plt .subplot (4 , 2 , 7 )
sns .countplot (y = 'purpose' , palette = 'BrBG' , data = loan )
plt .tight_layout ()
plt .show ()
Most of the approved loans seems to be having loan term of 36 months.
B, A and C Grade loans seems to be more compared to others
We can say that most loans are borrowed by people with either 0-3 years of exp or greater than 10 years.
Rented homes and mortgage seems to be predominant over people who own a house.
Most of the accepted loans are not verified.
About 1/6th of all accepted loans are 'Charged off'. The rest are fully paid.
Debt consolidation and Credit card loan appears to be the primary purpose for loan application .
print ("%.2f" % (loan .loc [loan ['loan_status' ] == 'Charged Off' ].loan_status .count () * 100 / len (loan )))Approximately 14.6% of loans in the dataset are defaulted.
loan_purpose = pd .DataFrame (loan .groupby ('purpose' )['charged_off' ,'fully_paid' ].sum ().reset_index ())
loan_purpose D:\HP\Anaconda3\envs\AI\lib\site-packages\ipykernel_launcher.py:1: FutureWarning: Indexing with multiple keys (implicitly converted to a tuple of keys) will be deprecated, use a list instead.
"""Entry point for launching an IPython kernel.
<style scoped>
.dataframe tbody tr th:only-of-type {
vertical-align: middle;
}
.dataframe tbody tr th {
    vertical-align: top;
}

.dataframe thead th {
    text-align: right;
}
</style>
purpose
charged_off
fully_paid
0
car
160
1339
1
credit_card
542
4485
2
debt_consolidation
2767
15288
3
educational
56
269
4
home_improvement
347
2528
5
house
59
308
6
major_purchase
222
1928
7
medical
106
575
8
moving
92
484
9
other
633
3232
10
renewable_energy
19
83
11
small_business
475
1279
12
vacation
53
322
13
wedding
96
830
#bar chart
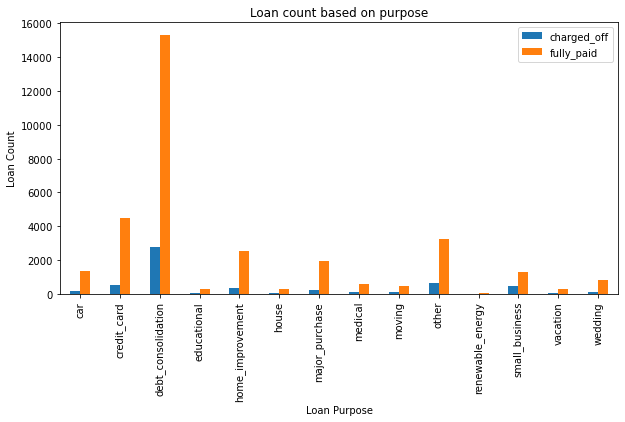
loan_purpose .plot .bar (x = 'purpose' , y = ['charged_off' ,'fully_paid' ],figsize = [10 ,5 ])
plt .ylabel ('Loan Count' )
plt .xlabel ('Loan Purpose' )
plt .title ("Loan count based on purpose" )Text(0.5, 1.0, 'Loan count based on purpose')
# Calculate percentage
r = [0 ,1 ,2 ,3 ,4 ,5 ,6 ,7 ,8 ,9 ,10 ,11 ,12 ,13 ]
totals = [i + j for i ,j in zip (loan_purpose ['charged_off' ], loan_purpose ['fully_paid' ])]
charged_off = [i / j * 100 for i ,j in zip (loan_purpose ['charged_off' ], totals )]
fully_paid = [i / j * 100 for i ,j in zip (loan_purpose ['fully_paid' ], totals )]
names = list (loan_purpose ['purpose' ])
# plot
plt .figure (figsize = (8 , 15 ), dpi = 80 , facecolor = 'w' , edgecolor = 'k' )
# subplot 1: stacked bar
plt .subplot (3 , 1 , 1 )
barWidth = 0.85
# Create charged_off Bars
plt .bar (r , charged_off , color = '#b5ffb9' , edgecolor = 'white' , width = barWidth )
# Create fully paid Bars
plt .bar (r , fully_paid , bottom = [i for i in charged_off ], color = '#a3acff' , edgecolor = 'white' , width = barWidth )
# Custom x axis
plt .xticks (r , names , rotation = 'vertical' )
plt .legend (['charged_off' ,'fully_paid' ],frameon = True , fontsize = 'small' , shadow = 'True' , title = 'Loan Status' , bbox_to_anchor = (1.05 , 1 ), loc = 2 , borderaxespad = 0. )
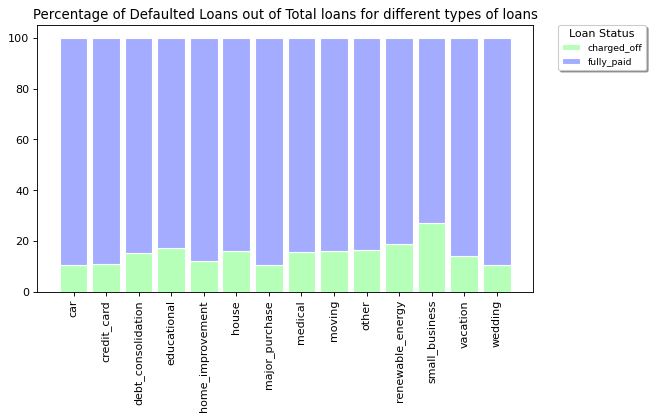
plt .title ("Percentage of Defaulted Loans out of Total loans for different types of loans" )Text(0.5, 1.0, 'Percentage of Defaulted Loans out of Total loans for different types of loans')
Small business have highest % of charged off loans.
Debt_consolidation has highest no of charged off loans.
loan_term = pd .DataFrame (loan .groupby ('term' )['charged_off' ,'fully_paid' ].sum ().reset_index ())
loan_term D:\HP\Anaconda3\envs\AI\lib\site-packages\ipykernel_launcher.py:1: FutureWarning: Indexing with multiple keys (implicitly converted to a tuple of keys) will be deprecated, use a list instead.
"""Entry point for launching an IPython kernel.
<style scoped>
.dataframe tbody tr th:only-of-type {
vertical-align: middle;
}
.dataframe tbody tr th {
    vertical-align: top;
}

.dataframe thead th {
    text-align: right;
}
</style>
term
charged_off
fully_paid
0
36 months
3227
25869
1
60 months
2400
7081
#bar chart
loan_term .plot .bar (x = 'term' , y = ['charged_off' ,'fully_paid' ],figsize = [8 ,5 ])
plt .ylabel ('Loan Count' )
plt .xlabel ('Loan Term' )
plt .title ("Loan Count based on Term" )Text(0.5, 1.0, 'Loan Count based on Term')
#Calculate percentage
r = [0 ,1 ]
totals = [i + j for i ,j in zip (loan_term ['charged_off' ], loan_term ['fully_paid' ])]
charged_off = [i / j * 100 for i ,j in zip (loan_term ['charged_off' ], totals )]
fully_paid = [i / j * 100 for i ,j in zip (loan_term ['fully_paid' ], totals )]
names = list (loan_term ['term' ])
# plot
plt .figure (figsize = (12 , 10 ), dpi = 80 , facecolor = 'w' , edgecolor = 'k' )
#stacked bar
plt .subplot (2 , 2 , 1 )
barWidth = 0.85
# Create charged_off Bars
plt .bar (r , charged_off , color = '#b5ffb9' , edgecolor = 'white' , width = barWidth )
# Create fully paid Bars
plt .bar (r , fully_paid , bottom = [i for i in charged_off ], color = '#a3acff' , edgecolor = 'white' , width = barWidth )
# Custom x axis
plt .xticks (r , names )
plt .legend (['charged_off' ,'fully_paid' ],frameon = True , fontsize = 'small' , shadow = 'True' , title = 'Loan Status' , bbox_to_anchor = (1.05 , 1 ), loc = 2 , borderaxespad = 0. )
plt .title ("Percentage of Defaulted Loans out of Total loans for different loan terms" )Text(0.5, 1.0, 'Percentage of Defaulted Loans out of Total loans for different loan terms')
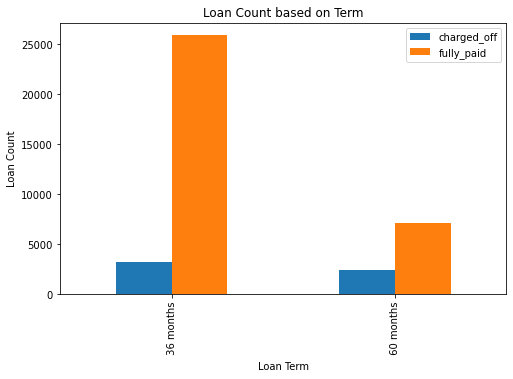
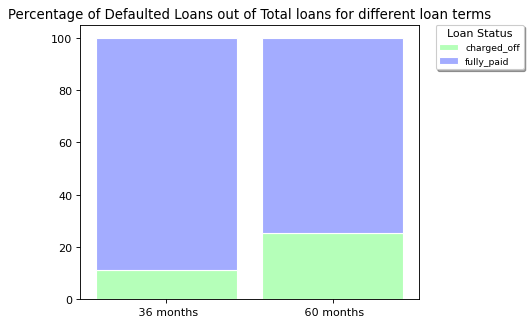
Loans whose term is over 60 months have deafault rate that is twice that of deafault rate of loans whose term is 36 months.
We can also observe that more deafulters are observed in loans that spans over 36 months as compared to loans that spans over 60months
loan_issue_yr = pd .DataFrame (loan .groupby ('issue_d_year' )['charged_off' ,'fully_paid' ].sum ().reset_index ())
loan_issue_yr D:\HP\Anaconda3\envs\AI\lib\site-packages\ipykernel_launcher.py:1: FutureWarning: Indexing with multiple keys (implicitly converted to a tuple of keys) will be deprecated, use a list instead.
"""Entry point for launching an IPython kernel.
<style scoped>
.dataframe tbody tr th:only-of-type {
vertical-align: middle;
}
.dataframe tbody tr th {
    vertical-align: top;
}

.dataframe thead th {
    text-align: right;
}
</style>
issue_d_year
charged_off
fully_paid
0
2007
45
206
1
2008
247
1315
2
2009
594
4122
3
2010
1485
10047
4
2011
3256
17260
#bar chart
loan_issue_yr .plot .bar (x = 'issue_d_year' , y = ['charged_off' ,'fully_paid' ],figsize = [8 ,5 ])
plt .ylabel ('Loan Count' )
plt .xlabel ('Loan Issued Date(Year)' )
plt .title ("Year wise loans count" )Text(0.5, 1.0, 'Year wise loans count')
#percentage
r = list (loan_issue_yr .index ) #r = [0,1,2]
totals = [i + j for i ,j in zip (loan_issue_yr ['charged_off' ], loan_issue_yr ['fully_paid' ])]
charged_off = [i / j * 100 for i ,j in zip (loan_issue_yr ['charged_off' ], totals )]
fully_paid = [i / j * 100 for i ,j in zip (loan_issue_yr ['fully_paid' ], totals )]
names = list (loan_issue_yr ['issue_d_year' ])
# plot
plt .figure (figsize = (12 , 10 ), dpi = 80 , facecolor = 'w' , edgecolor = 'k' )
#stacked bar
plt .subplot (2 , 2 , 1 )
barWidth = 0.85
# Create charged_off Bars
plt .bar (r , charged_off , color = '#636363' , edgecolor = 'white' , width = barWidth )
# Create fully paid Bars
plt .bar (r , fully_paid , bottom = [i for i in charged_off ], color = '#a3acff' , edgecolor = 'white' , width = barWidth )
# Custom x axis
plt .xticks (r , names , rotation = 'vertical' )
plt .legend (['charged_off' ,'fully_paid' ],frameon = True , fontsize = 'small' , shadow = 'True' , title = 'Loan Status' , bbox_to_anchor = (1.05 , 1 ), loc = 2 , borderaxespad = 0. )
plt .title ("Year wise Loan Default Rate" )Text(0.5, 1.0, 'Year wise Loan Default Rate')
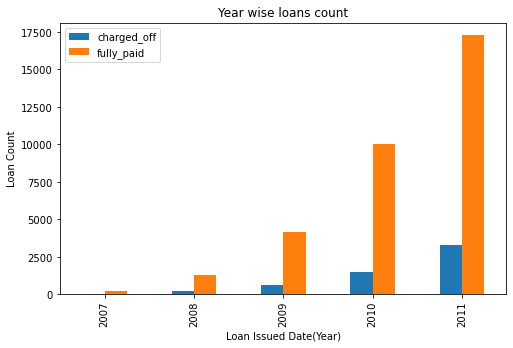
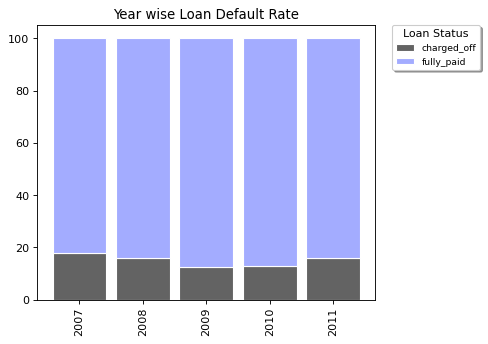
Its evident that no of Defaulters are increasing every year
Its also interesting to note that though defaulters are increasing the default rate was maximum on 2007 followed by 2011
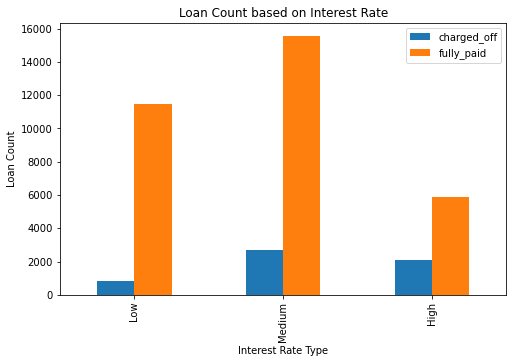
loan_ir = pd .DataFrame (loan .groupby ('interest_rate_bins' )['charged_off' ,'fully_paid' ].sum ().reset_index ())
loan_ir D:\HP\Anaconda3\envs\AI\lib\site-packages\ipykernel_launcher.py:1: FutureWarning: Indexing with multiple keys (implicitly converted to a tuple of keys) will be deprecated, use a list instead.
"""Entry point for launching an IPython kernel.
<style scoped>
.dataframe tbody tr th:only-of-type {
vertical-align: middle;
}
.dataframe tbody tr th {
    vertical-align: top;
}

.dataframe thead th {
    text-align: right;
}
</style>
interest_rate_bins
charged_off
fully_paid
0
Low
830
11486
1
Medium
2707
15558
2
High
2090
5906
#bar chart
loan_ir .plot .bar (x = 'interest_rate_bins' , y = ['charged_off' ,'fully_paid' ],figsize = [8 ,5 ])
plt .ylabel ('Loan Count' )
plt .xlabel ('Interest Rate Type' )
plt .title ("Loan Count based on Interest Rate" )Text(0.5, 1.0, 'Loan Count based on Interest Rate')
#percentage
r = [0 ,1 ,2 ]
totals = [i + j for i ,j in zip (loan_ir ['charged_off' ], loan_ir ['fully_paid' ])]
charged_off = [i / j * 100 for i ,j in zip (loan_ir ['charged_off' ], totals )]
fully_paid = [i / j * 100 for i ,j in zip (loan_ir ['fully_paid' ], totals )]
names = list (loan_ir ['interest_rate_bins' ])
# plot
plt .figure (figsize = (12 , 10 ), dpi = 80 , facecolor = 'w' , edgecolor = 'k' )
#stacked bar
plt .subplot (2 , 2 , 1 )
barWidth = 0.85
# Create charged_off Bars
plt .bar (r , charged_off , color = '#636363' , edgecolor = 'white' , width = barWidth )
# Create fully paid Bars
plt .bar (r , fully_paid , bottom = [i for i in charged_off ], color = '#a3acff' , edgecolor = 'white' , width = barWidth )
# Custom x axis
plt .xticks (r , names , rotation = 'vertical' )
plt .legend (['charged_off' ,'fully_paid' ],frameon = True , fontsize = 'small' , shadow = 'True' , title = 'Loan Status' , bbox_to_anchor = (1.05 , 1 ), loc = 2 , borderaxespad = 0. )
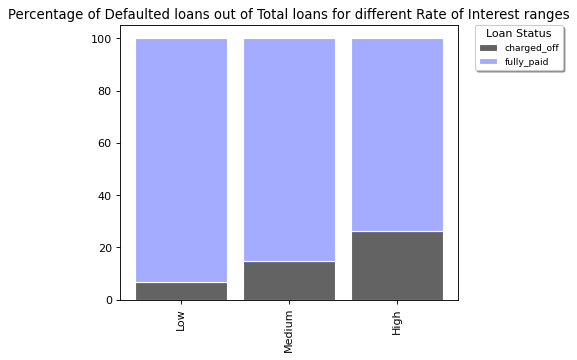
plt .title ("Percentage of Defaulted loans out of Total loans for different Rate of Interest ranges" )Text(0.5, 1.0, 'Percentage of Defaulted loans out of Total loans for different Rate of Interest ranges')
We can observe that the default rate increases as the rate of interest increases.
The defaulters are more likely observed in loans where interest rate is between 10% and 15%
loan_grade = pd .DataFrame (loan .groupby ('grade' )['charged_off' ,'fully_paid' ].sum ().reset_index ())
loan_grade D:\HP\Anaconda3\envs\AI\lib\site-packages\ipykernel_launcher.py:1: FutureWarning: Indexing with multiple keys (implicitly converted to a tuple of keys) will be deprecated, use a list instead.
"""Entry point for launching an IPython kernel.
<style scoped>
.dataframe tbody tr th:only-of-type {
vertical-align: middle;
}
.dataframe tbody tr th {
    vertical-align: top;
}

.dataframe thead th {
    text-align: right;
}
</style>
grade
charged_off
fully_paid
0
A
602
9443
1
B
1425
10250
2
C
1347
6487
3
D
1118
3967
4
E
715
1948
5
F
319
657
6
G
101
198
#bar chart
loan_grade .plot .bar (x = 'grade' , y = ['charged_off' ,'fully_paid' ],figsize = [8 ,5 ])
plt .ylabel ('Loan Count' )
plt .xlabel ('Loan Grades' )
plt .title ("Loan Count based on Loan Grade" )Text(0.5, 1.0, 'Loan Count based on Loan Grade')
#Calculate percentage
r = [0 ,1 ,2 ,3 ,4 ,5 ,6 ]
totals = [i + j for i ,j in zip (loan_grade ['charged_off' ], loan_grade ['fully_paid' ])]
charged_off = [i / j * 100 for i ,j in zip (loan_grade ['charged_off' ], totals )]
fully_paid = [i / j * 100 for i ,j in zip (loan_grade ['fully_paid' ], totals )]
names = list (loan_grade ['grade' ])
# plot
plt .figure (figsize = (15 , 10 ), dpi = 80 , facecolor = 'w' , edgecolor = 'k' )
#stacked bar
plt .subplot (2 , 2 , 1 )
barWidth = 0.85
# Create charged_off Bars
plt .bar (r , charged_off , color = '#b5ffb9' , edgecolor = 'white' , width = barWidth )
# Create fully paid Bars
plt .bar (r , fully_paid , bottom = [i for i in charged_off ], color = '#a3acff' , edgecolor = 'white' , width = barWidth )
# Custom x axis
plt .xticks (r , names , rotation = 'vertical' )
plt .legend (['charged_off' ,'fully_paid' ],frameon = True , fontsize = 'small' , shadow = 'True' , title = 'Loan Status' , bbox_to_anchor = (1.05 , 1 ), loc = 2 , borderaxespad = 0. )
plt .title ("Percentage of Defaulted Loans out of Total loans for different Loan Grades" )Text(0.5, 1.0, 'Percentage of Defaulted Loans out of Total loans for different Loan Grades')
Default rate in loan increases from grade A to G.
Loan applications with grades B, C and D have the highest no of Defaulters
loan_subgrade = pd .DataFrame (loan .groupby (['sub_grade' ])['charged_off' ,'fully_paid' ].sum ())
loan_subgrade D:\HP\Anaconda3\envs\AI\lib\site-packages\ipykernel_launcher.py:1: FutureWarning: Indexing with multiple keys (implicitly converted to a tuple of keys) will be deprecated, use a list instead.
"""Entry point for launching an IPython kernel.
<style scoped>
.dataframe tbody tr th:only-of-type {
vertical-align: middle;
}
.dataframe tbody tr th {
    vertical-align: top;
}

.dataframe thead th {
    text-align: right;
}
</style>
charged_off
fully_paid
sub_grade
A1
30
1109
A2
74
1434
A3
103
1707
A4
178
2695
A5
217
2498
B1
171
1626
B2
228
1773
B3
341
2484
B4
329
2108
B5
356
2259
C1
336
1719
C2
321
1610
C3
270
1218
C4
212
994
C5
208
946
D1
167
764
D2
271
1015
D3
256
860
D4
215
703
D5
209
625
E1
198
524
E2
163
451
E3
119
397
E4
126
298
E5
109
278
F1
91
214
F2
70
163
F3
51
123
F4
53
98
F5
54
59
G1
31
63
G2
28
49
G3
19
26
G4
13
41
G5
10
19
#bar plot
loan_subgrade .plot .bar (figsize = (12 ,6 ))
plt .xlabel ('Loan Sub Grade' )
plt .ylabel ('Loan Count' )
plt .title ("Loans Count based on Sub Grades" )
plt .tight_layout ()
plt .show ()
Employment Length(Borrower Experience) emp_exp = pd .DataFrame (loan .groupby ('emp_length' )['charged_off' ,'fully_paid' ].sum ().reset_index ())
emp_exp D:\HP\Anaconda3\envs\AI\lib\site-packages\ipykernel_launcher.py:1: FutureWarning: Indexing with multiple keys (implicitly converted to a tuple of keys) will be deprecated, use a list instead.
"""Entry point for launching an IPython kernel.
<style scoped>
.dataframe tbody tr th:only-of-type {
vertical-align: middle;
}
.dataframe tbody tr th {
    vertical-align: top;
}

.dataframe thead th {
    text-align: right;
}
</style>
emp_length
charged_off
fully_paid
0
1 year
456
2713
1
10+ years
1331
7157
2
2 years
567
3724
3
3 years
555
3457
4
4 years
462
2880
5
5 years
458
2736
6
6 years
307
1861
7
7 years
263
1448
8
8 years
203
1232
9
9 years
158
1068
10
< 1 year
639
3869
#bar chart
emp_exp .plot .bar (x = 'emp_length' , y = ['charged_off' ,'fully_paid' ],figsize = [8 ,5 ])
plt .ylabel ('Loan Count' )
plt .xlabel ('Borrower Experience' )
plt .title ("Loan Count based on Borrower Experience" )Text(0.5, 1.0, 'Loan Count based on Borrower Experience')
#Percentage
r = [0 ,1 ,2 ,3 ,4 ,5 ,6 ,7 ,8 ,9 ,10 ]
totals = [i + j for i ,j in zip (emp_exp ['charged_off' ], emp_exp ['fully_paid' ])]
charged_off = [i / j * 100 for i ,j in zip (emp_exp ['charged_off' ], totals )]
fully_paid = [i / j * 100 for i ,j in zip (emp_exp ['fully_paid' ], totals )]
names = list (emp_exp ['emp_length' ])
# plot
plt .figure (figsize = (8 , 15 ), dpi = 80 , facecolor = 'w' , edgecolor = 'k' )
#stacked bar
plt .subplot (3 , 1 , 1 )
barWidth = 0.85
# Create charged_off Bars
plt .bar (r , charged_off , color = '#b5ffb9' , edgecolor = 'white' , width = barWidth )
# Create fully paid Bars
plt .bar (r , fully_paid , bottom = [i for i in charged_off ], color = '#a3acff' , edgecolor = 'white' , width = barWidth )
# Custom x axis
plt .xticks (r , names , rotation = 'vertical' )
plt .legend (['charged_off' ,'fully_paid' ],frameon = True , fontsize = 'small' , shadow = 'True' , title = 'Loan Status' , bbox_to_anchor = (1.05 , 1 ), loc = 2 , borderaxespad = 0. )
plt .title ("Percentage of Defaulted Loans out of Total loans for different Employment Lengths" )Text(0.5, 1.0, 'Percentage of Defaulted Loans out of Total loans for different Employment Lengths')
Here we can see that more defaulters can be observed in the bins where borrowers experience are 10+ years and 1 year or lesser
As far as default rate is concerned no significant trend is seen as all of them are more or less closer to each other
Analysis on Home Ownership loan_home_ownership = pd .DataFrame (loan .groupby ('home_ownership' )['charged_off' ,'fully_paid' ].sum ().reset_index ())
loan_home_ownership D:\HP\Anaconda3\envs\AI\lib\site-packages\ipykernel_launcher.py:1: FutureWarning: Indexing with multiple keys (implicitly converted to a tuple of keys) will be deprecated, use a list instead.
"""Entry point for launching an IPython kernel.
<style scoped>
.dataframe tbody tr th:only-of-type {
vertical-align: middle;
}
.dataframe tbody tr th {
    vertical-align: top;
}

.dataframe thead th {
    text-align: right;
}
</style>
home_ownership
charged_off
fully_paid
0
MORTGAGE
2327
14694
1
NONE
0
3
2
OTHER
18
80
3
OWN
443
2532
4
RENT
2839
15641
#bar chart
loan_home_ownership .plot .bar (x = 'home_ownership' , y = ['charged_off' ,'fully_paid' ],figsize = [8 ,5 ])
plt .ylabel ('Loan Count' )
plt .xlabel ('Home Ownership' )
plt .title ("Home Ownership based Loan count" )Text(0.5, 1.0, 'Home Ownership based Loan count')
# From raw value to percentage
r = [0 ,1 ,2 ,3 ,4 ]
totals = [i + j for i ,j in zip (loan_home_ownership ['charged_off' ], loan_home_ownership ['fully_paid' ])]
charged_off = [i / j * 100 for i ,j in zip (loan_home_ownership ['charged_off' ], totals )]
fully_paid = [i / j * 100 for i ,j in zip (loan_home_ownership ['fully_paid' ], totals )]
names = list (loan_home_ownership ['home_ownership' ])
# plot
plt .figure (figsize = (12 , 10 ), dpi = 80 , facecolor = 'w' , edgecolor = 'k' )
#stacked bar
plt .subplot (2 , 2 , 1 )
barWidth = 0.85
# Create charged_off Bars
plt .bar (r , charged_off , color = '#b5ffb9' , edgecolor = 'white' , width = barWidth )
# Create fully paid Bars
plt .bar (r , fully_paid , bottom = [i for i in charged_off ], color = '#a3acff' , edgecolor = 'white' , width = barWidth )
# Custom x axis
plt .xticks (r , names , rotation = 'vertical' )
plt .legend (['charged_off' ,'fully_paid' ],frameon = True , fontsize = 'small' , shadow = 'True' , title = 'Loan Status' , bbox_to_anchor = (1.05 , 1 ), loc = 2 , borderaxespad = 0. )
plt .title ("Default rate for different Home Ownership types" , fontsize = 'medium' )Text(0.5, 1.0, 'Default rate for different Home Ownership types')
Default rate in home ownership type 'Other' is slightly high over others.
It appears that most defaulters are the borrowers with ownership types house-mortgage and house-rent.
Analysis on Verification_status loan_verification_status = pd .DataFrame (loan .groupby ('verification_status' )['charged_off' ,'fully_paid' ].sum ().reset_index ())
loan_verification_status D:\HP\Anaconda3\envs\AI\lib\site-packages\ipykernel_launcher.py:1: FutureWarning: Indexing with multiple keys (implicitly converted to a tuple of keys) will be deprecated, use a list instead.
"""Entry point for launching an IPython kernel.
<style scoped>
.dataframe tbody tr th:only-of-type {
vertical-align: middle;
}
.dataframe tbody tr th {
    vertical-align: top;
}

.dataframe thead th {
    text-align: right;
}
</style>
verification_status
charged_off
fully_paid
0
Not Verified
2142
14552
1
Source Verified
1434
8243
2
Verified
2051
10155
#bar chart
loan_verification_status .plot .bar (x = 'verification_status' , y = ['charged_off' ,'fully_paid' ],figsize = [8 ,5 ])
plt .ylabel ('Loans Count' )
plt .xlabel ('Verification Status' )
plt .title ("Verification Status wise Loans count" )Text(0.5, 1.0, 'Verification Status wise Loans count')
#Calculate percentage
r = [0 ,1 ,2 ]
totals = [i + j for i ,j in zip (loan_verification_status ['charged_off' ], loan_verification_status ['fully_paid' ])]
charged_off = [i / j * 100 for i ,j in zip (loan_verification_status ['charged_off' ], totals )]
fully_paid = [i / j * 100 for i ,j in zip (loan_verification_status ['fully_paid' ], totals )]
names = list (loan_verification_status ['verification_status' ])
# plot
plt .figure (figsize = (12 , 10 ), dpi = 80 , facecolor = 'w' , edgecolor = 'k' )
#stacked bar
plt .subplot (2 , 2 , 1 )
barWidth = 0.85
# Create charged_off Bars
plt .bar (r , charged_off , color = '#b5ffb9' , edgecolor = 'white' , width = barWidth )
# Create fully paid Bars
plt .bar (r , fully_paid , bottom = [i for i in charged_off ], color = '#a3acff' , edgecolor = 'white' , width = barWidth )
# Custom x axis
plt .xticks (r , names , rotation = 'vertical' )
plt .legend (['charged_off' ,'fully_paid' ],frameon = True , fontsize = 'small' , shadow = 'True' , title = 'Loan Status' , bbox_to_anchor = (1.05 , 1 ), loc = 2 , borderaxespad = 0. )
plt .title ("Default rate for different Verification Statuses" , fontsize = 'medium' )Text(0.5, 1.0, 'Default rate for different Verification Statuses')
Default Rate is slightly more for ‘Verified’ loans followed by ‘Source verified’ ones and ‘Not verified’ ones
Analysis considering loans from various states loan_addr_state = pd .DataFrame (loan .groupby ('addr_state' )['charged_off' ,'fully_paid' ].sum ().reset_index ())
loan_addr_state D:\HP\Anaconda3\envs\AI\lib\site-packages\ipykernel_launcher.py:1: FutureWarning: Indexing with multiple keys (implicitly converted to a tuple of keys) will be deprecated, use a list instead.
"""Entry point for launching an IPython kernel.
<style scoped>
.dataframe tbody tr th:only-of-type {
vertical-align: middle;
}
.dataframe tbody tr th {
    vertical-align: top;
}

.dataframe thead th {
    text-align: right;
}
</style>
addr_state
charged_off
fully_paid
0
AK
15
63
1
AL
54
381
2
AR
27
208
3
AZ
123
726
4
CA
1125
5824
5
CO
98
668
6
CT
94
632
7
DC
15
196
8
DE
12
101
9
FL
504
2277
10
GA
215
1144
11
HI
28
138
12
IA
0
5
13
ID
1
5
14
IL
197
1281
15
IN
0
9
16
KS
31
224
17
KY
45
266
18
LA
53
374
19
MA
159
1138
20
MD
162
861
21
ME
0
3
22
MI
103
601
23
MN
81
524
24
MO
114
556
25
MS
2
17
26
MT
11
72
27
NC
114
636
28
NE
3
2
29
NH
25
141
30
NJ
278
1512
31
NM
30
153
32
NV
108
371
33
NY
495
3203
34
OH
155
1023
35
OK
40
247
36
OR
71
364
37
PA
180
1288
38
RI
25
169
39
SC
66
393
40
SD
12
50
41
TN
2
15
42
TX
316
2343
43
UT
40
212
44
VA
177
1192
45
VT
6
47
46
WA
127
691
47
WI
63
377
48
WV
21
151
49
WY
4
76
#bar chart
loan_addr_state .plot .bar (x = 'addr_state' , y = ['charged_off' ,'fully_paid' ],figsize = [20 ,8 ])
plt .ylabel ('Loans Count' )
plt .xlabel ('States' )
plt .title ("State wise Loans count" )Text(0.5, 1.0, 'State wise Loans count')
# Calculate percentage
r = list (loan_addr_state .index )
totals = [i + j for i ,j in zip (loan_addr_state ['charged_off' ], loan_addr_state ['fully_paid' ])]
charged_off = [i / j * 100 for i ,j in zip (loan_addr_state ['charged_off' ], totals )]
fully_paid = [i / j * 100 for i ,j in zip (loan_addr_state ['fully_paid' ], totals )]
names = list (loan_addr_state ['addr_state' ])
# plot
plt .figure (figsize = (20 , 20 ), dpi = 80 , facecolor = 'w' , edgecolor = 'k' )
#stacked bar
plt .subplot (3 , 1 , 1 )
barWidth = 0.85
# Create charged_off Bars
plt .bar (r , charged_off , color = '#b5ffb9' , edgecolor = 'white' , width = barWidth )
# Create fully paid Bars
plt .bar (r , fully_paid , bottom = [i for i in charged_off ], color = '#a3acff' , edgecolor = 'white' , width = barWidth )
# Custom x axis
plt .xticks (r , names , rotation = 'vertical' )
plt .legend (['charged_off' ,'fully_paid' ],frameon = True , fontsize = 'small' , shadow = 'True' , title = 'Loan Status' , bbox_to_anchor = (1.05 , 1 ), loc = 2 , borderaxespad = 0. )
plt .title ("Percentage of Defaulted Loans out of Total loans across different States" )Text(0.5, 1.0, 'Percentage of Defaulted Loans out of Total loans across different States')
Default Rate is maximum in the state NE .
CA has maximum no of Defaulters followed by NY, FL and TX.
Analysis of Loans based on DTI loan_dti_bins = pd .DataFrame (loan .groupby ('dti_bins' )['charged_off' ,'fully_paid' ].sum ().reset_index ())
loan_dti_bins D:\HP\Anaconda3\envs\AI\lib\site-packages\ipykernel_launcher.py:1: FutureWarning: Indexing with multiple keys (implicitly converted to a tuple of keys) will be deprecated, use a list instead.
"""Entry point for launching an IPython kernel.
<style scoped>
.dataframe tbody tr th:only-of-type {
vertical-align: middle;
}
.dataframe tbody tr th {
    vertical-align: top;
}

.dataframe thead th {
    text-align: right;
}
</style>
dti_bins
charged_off
fully_paid
0
Less Than 5
626
4436
1
Btwn 5 & 10
1005
6868
2
Btwn 10 & 15
1402
8228
3
Btwn 15 & 20
1389
7422
4
Btwn 20 & 25
1118
5460
5
Btwn 25 & 30
87
536
#bar chart
loan_dti_bins .plot .bar (x = 'dti_bins' , y = ['charged_off' ,'fully_paid' ],figsize = [10 ,5 ])
plt .ylabel ('Loans Count' )
plt .xlabel ('DTI Bins' )
plt .title ("Loans across different DTI Bins" )Text(0.5, 1.0, 'Loans across different DTI Bins')
# Compute percentage
r = list (loan_dti_bins .index )
totals = [i + j for i ,j in zip (loan_dti_bins ['charged_off' ], loan_dti_bins ['fully_paid' ])]
charged_off = [i / j * 100 for i ,j in zip (loan_dti_bins ['charged_off' ], totals )]
fully_paid = [i / j * 100 for i ,j in zip (loan_dti_bins ['fully_paid' ], totals )]
names = list (loan_dti_bins ['dti_bins' ])
# plot
plt .figure (figsize = (15 , 10 ), dpi = 80 , facecolor = 'w' , edgecolor = 'k' )
#stacked bar
plt .subplot (2 , 2 , 1 )
barWidth = 0.85
# Create charged_off Bars
plt .bar (r , charged_off , color = '#b5ffb9' , edgecolor = 'white' , width = barWidth )
# Create fully paid Bars
plt .bar (r , fully_paid , bottom = [i for i in charged_off ], color = '#a3acff' , edgecolor = 'white' , width = barWidth )
# Custom x axis
plt .xticks (r , names , rotation = 'vertical' )
plt .legend (['charged_off' ,'fully_paid' ],frameon = True , fontsize = 'small' , shadow = 'True' , title = 'Loan Status' , bbox_to_anchor = (1.05 , 1 ), loc = 2 , borderaxespad = 0. )
plt .title ("Percentage of Defaulted Loans out of Total loans for different ranges of DTI" )Text(0.5, 1.0, 'Percentage of Defaulted Loans out of Total loans for different ranges of DTI')
Analysis of Loans based on Public records loan_pub_rec = pd .DataFrame (loan .groupby ('pub_rec' )['charged_off' ,'fully_paid' ].sum ().reset_index ())
loan_pub_rec D:\HP\Anaconda3\envs\AI\lib\site-packages\ipykernel_launcher.py:1: FutureWarning: Indexing with multiple keys (implicitly converted to a tuple of keys) will be deprecated, use a list instead.
"""Entry point for launching an IPython kernel.
<style scoped>
.dataframe tbody tr th:only-of-type {
vertical-align: middle;
}
.dataframe tbody tr th {
    vertical-align: top;
}

.dataframe thead th {
    text-align: right;
}
</style>
pub_rec
charged_off
fully_paid
0
0
5160
31347
1
1
457
1556
2
2
10
38
3
3
0
7
4
4
0
2
#bar chart
loan_pub_rec .plot .bar (x = 'pub_rec' , y = ['charged_off' ,'fully_paid' ],figsize = [10 ,5 ])
plt .ylabel ('Loans Count' )
plt .xlabel ('No of Public Records' )
plt .title ("Loans count based on Public Records" )Text(0.5, 1.0, 'Loans count based on Public Records')
# Compute percentage
r = list (loan_pub_rec .index )
totals = [i + j for i ,j in zip (loan_pub_rec ['charged_off' ], loan_pub_rec ['fully_paid' ])]
charged_off = [i / j * 100 for i ,j in zip (loan_pub_rec ['charged_off' ], totals )]
fully_paid = [i / j * 100 for i ,j in zip (loan_pub_rec ['fully_paid' ], totals )]
names = list (loan_pub_rec ['pub_rec' ])
# plot
plt .figure (figsize = (12 , 10 ), dpi = 80 , facecolor = 'w' , edgecolor = 'k' )
#stacked bar
plt .subplot (2 , 2 , 1 )
barWidth = 0.85
# Create charged_off Bars
plt .bar (r , charged_off , color = '#b5ffb9' , edgecolor = 'white' , width = barWidth )
# Create fully paid Bars
plt .bar (r , fully_paid , bottom = [i for i in charged_off ], color = '#a3acff' , edgecolor = 'white' , width = barWidth )
# Custom x axis
plt .xticks (r , names , rotation = 'vertical' )
plt .legend (['charged_off' ,'fully_paid' ],frameon = True , fontsize = 'small' , shadow = 'True' , title = 'Loan Status' , bbox_to_anchor = (1.05 , 1 ), loc = 2 , borderaxespad = 0. )
plt .title ("Percentage of Defaulted Loans out of Total loans for different Pub_rec Values" , fontsize = 'medium' )Text(0.5, 1.0, 'Percentage of Defaulted Loans out of Total loans for different Pub_rec Values')
Default Rate is highest for pub_rec value 1 and 2 compared to 0.
Analysis of Loans based on Annual Income #Creating bins for Annual Income
cut_points = [0 ,20000 ,40000 ,60000 ,80000 ,100000 ,120000 ,140000 ,160000 ]
label_names = ["Less Than 20000" ,"Btwn 20000 & 40000" ,"Btwn 40000 & 60000" ,"Btwn 60000 & 80000" ,"Btwn 80000 & 100000" ,"Btwn 100000 & 120000" ,"Btwn 120000 & 140000" ,"Above 140000" ]
column_index = loan .columns .get_loc ('annual_inc' ) + 1
loan .insert (loc = column_index ,column = 'annual_inc_range' ,value = pd .cut (loan ['annual_inc' ],cut_points ,labels = label_names , include_lowest = True ))
loan
<style scoped>
.dataframe tbody tr th:only-of-type {
vertical-align: middle;
}
.dataframe tbody tr th {
    vertical-align: top;
}

.dataframe thead th {
    text-align: right;
}
</style>
id
member_id
loan_amnt
funded_amnt
funded_amnt_inv
term
int_rate
interest_rate_bins
installment
grade
sub_grade
emp_title
emp_length
home_ownership
annual_inc
annual_inc_range
verification_status
issue_d
loan_status
purpose
addr_state
dti
dti_bins
delinq_2yrs
earliest_cr_line
inq_last_6mths
open_acc
pub_rec
revol_bal
total_acc
out_prncp
out_prncp_inv
total_pymnt
total_pymnt_inv
total_rec_prncp
total_rec_int
total_rec_late_fee
recoveries
collection_recovery_fee
last_pymnt_amnt
last_credit_pull_d
pub_rec_bankruptcies
fully_paid
charged_off
issue_d_month
issue_d_year
0
1077501
1296599
5000
5000
4975.0
36 months
10.65
Medium
162.87
B
B2
NaN
10+ years
RENT
24000.0
Btwn 20000 & 40000
Verified
2011-12-01
Fully Paid
credit_card
AZ
27.65
Btwn 25 & 30
0
Jan-85
1
3
0
13648
9
0.0
0.0
5863.155187
5833.84
5000.00
863.16
0.00
0.00
0.00
171.62
May-16
0.0
1
0
12
2011
1
1077430
1314167
2500
2500
2500.0
60 months
15.27
High
59.83
C
C4
Ryder
< 1 year
RENT
30000.0
Btwn 20000 & 40000
Source Verified
2011-12-01
Charged Off
car
GA
1.00
Less Than 5
0
Apr-99
5
3
0
1687
4
0.0
0.0
1008.710000
1008.71
456.46
435.17
0.00
117.08
1.11
119.66
Sep-13
0.0
0
1
12
2011
2
1077175
1313524
2400
2400
2400.0
36 months
15.96
High
84.33
C
C5
NaN
10+ years
RENT
12252.0
Less Than 20000
Not Verified
2011-12-01
Fully Paid
small_business
IL
8.72
Btwn 5 & 10
0
Nov-01
2
2
0
2956
10
0.0
0.0
3005.666844
3005.67
2400.00
605.67
0.00
0.00
0.00
649.91
May-16
0.0
1
0
12
2011
3
1076863
1277178
10000
10000
10000.0
36 months
13.49
Medium
339.31
C
C1
AIR RESOURCES BOARD
10+ years
RENT
49200.0
Btwn 40000 & 60000
Source Verified
2011-12-01
Fully Paid
other
CA
20.00
Btwn 15 & 20
0
Feb-96
1
10
0
5598
37
0.0
0.0
12231.890000
12231.89
10000.00
2214.92
16.97
0.00
0.00
357.48
Apr-16
0.0
1
0
12
2011
5
1075269
1311441
5000
5000
5000.0
36 months
7.90
Low
156.46
A
A4
Veolia Transportaton
3 years
RENT
36000.0
Btwn 20000 & 40000
Source Verified
2011-12-01
Fully Paid
wedding
AZ
11.20
Btwn 10 & 15
0
Nov-04
3
9
0
7963
12
0.0
0.0
5632.210000
5632.21
5000.00
632.21
0.00
0.00
0.00
161.03
Jan-16
0.0
1
0
12
2011
...
...
...
...
...
...
...
...
...
...
...
...
...
...
...
...
...
...
...
...
...
...
...
...
...
...
...
...
...
...
...
...
...
...
...
...
...
...
...
...
...
...
...
...
...
...
...
39712
92187
92174
2500
2500
1075.0
36 months
8.07
Low
78.42
A
A4
FiSite Research
4 years
MORTGAGE
110000.0
Btwn 100000 & 120000
Not Verified
2007-07-01
Fully Paid
home_improvement
CO
11.33
Btwn 10 & 15
0
Nov-90
0
13
0
7274
40
0.0
0.0
2822.969293
1213.88
2500.00
322.97
0.00
0.00
0.00
80.90
Jun-10
NaN
1
0
7
2007
39713
90665
90607
8500
8500
875.0
36 months
10.28
Medium
275.38
C
C1
Squarewave Solutions, Ltd.
3 years
RENT
18000.0
Less Than 20000
Not Verified
2007-07-01
Fully Paid
credit_card
NC
6.40
Btwn 5 & 10
1
Dec-86
1
6
0
8847
9
0.0
0.0
9913.491822
1020.51
8500.00
1413.49
0.00
0.00
0.00
281.94
Jul-10
NaN
1
0
7
2007
39714
90395
90390
5000
5000
1325.0
36 months
8.07
Low
156.84
A
A4
NaN
< 1 year
MORTGAGE
100000.0
Btwn 80000 & 100000
Not Verified
2007-07-01
Fully Paid
debt_consolidation
MA
2.30
Less Than 5
0
Oct-98
0
11
0
9698
20
0.0
0.0
5272.161128
1397.12
5000.00
272.16
0.00
0.00
0.00
0.00
Jun-07
NaN
1
0
7
2007
39715
90376
89243
5000
5000
650.0
36 months
7.43
Low
155.38
A
A2
NaN
< 1 year
MORTGAGE
200000.0
NaN
Not Verified
2007-07-01
Fully Paid
other
MD
3.72
Less Than 5
0
Nov-88
0
17
0
85607
26
0.0
0.0
5174.198551
672.66
5000.00
174.20
0.00
0.00
0.00
0.00
Jun-07
NaN
1
0
7
2007
39716
87023
86999
7500
7500
800.0
36 months
13.75
Medium
255.43
E
E2
Evergreen Center
< 1 year
OWN
22000.0
Btwn 20000 & 40000
Not Verified
2007-06-01
Fully Paid
debt_consolidation
MA
14.29
Btwn 10 & 15
1
Oct-03
0
7
0
4175
8
0.0
0.0
9195.263334
980.83
7500.00
1695.26
0.00
0.00
0.00
256.59
Jun-10
NaN
1
0
6
2007
38577 rows × 46 columns
loan_inc = pd .DataFrame (loan .groupby ('annual_inc_range' )['charged_off' ,'fully_paid' ].sum ().reset_index ())
loan_inc D:\HP\Anaconda3\envs\AI\lib\site-packages\ipykernel_launcher.py:1: FutureWarning: Indexing with multiple keys (implicitly converted to a tuple of keys) will be deprecated, use a list instead.
"""Entry point for launching an IPython kernel.
<style scoped>
.dataframe tbody tr th:only-of-type {
vertical-align: middle;
}
.dataframe tbody tr th {
    vertical-align: top;
}

.dataframe thead th {
    text-align: right;
}
</style>
annual_inc_range
charged_off
fully_paid
0
Less Than 20000
237
943
1
Btwn 20000 & 40000
1514
7004
2
Btwn 40000 & 60000
1729
9534
3
Btwn 60000 & 80000
1024
6597
4
Btwn 80000 & 100000
531
3983
5
Btwn 100000 & 120000
244
2084
6
Btwn 120000 & 140000
137
1081
7
Above 140000
84
626
#bar chart
loan_inc .plot .bar (x = 'annual_inc_range' , y = ['charged_off' ,'fully_paid' ],figsize = [10 ,5 ])
plt .ylabel ('Loans Count' )
plt .xlabel ('Annual Income Range' )
plt .title ("Loans count based on Annual Income" )Text(0.5, 1.0, 'Loans count based on Annual Income')
# Compute Default Rate
r = list (loan_inc .index )
totals = [i + j for i ,j in zip (loan_inc ['charged_off' ], loan_inc ['fully_paid' ])]
charged_off = [i / j * 100 for i ,j in zip (loan_inc ['charged_off' ], totals )]
fully_paid = [i / j * 100 for i ,j in zip (loan_inc ['fully_paid' ], totals )]
names = list (loan_inc ['annual_inc_range' ])
# plot
plt .figure (figsize = (12 , 10 ), dpi = 80 , facecolor = 'w' , edgecolor = 'k' )
#stacked bar
plt .subplot (2 , 2 , 1 )
barWidth = 0.85
# Create charged_off Bars
plt .bar (r , charged_off , color = '#b5ffb9' , edgecolor = 'white' , width = barWidth )
# Create fully paid Bars
plt .bar (r , fully_paid , bottom = [i for i in charged_off ], color = '#a3acff' , edgecolor = 'white' , width = barWidth )
# Custom x axis
plt .xticks (r , names , rotation = 'vertical' )
plt .legend (['charged_off' ,'fully_paid' ],frameon = True , fontsize = 'small' , shadow = 'True' , title = 'Loan Status' , bbox_to_anchor = (1.05 , 1 ), loc = 2 , borderaxespad = 0. )
plt .title ("Percentage of Defaulted Loans out of Total loans based on Annual Income" )Text(0.5, 1.0, 'Percentage of Defaulted Loans out of Total loans based on Annual Income')
It seems that default rate decreases with increase in annual income of the borrower.
Most Defaulters are the Borrowers whose annual income is between 0-20K, 20k-40k and 40K-60K
Lets see how the loan amount is distributed across loan statuses # adjust figure size
plt .figure (figsize = (10 , 6 ), dpi = 80 , facecolor = 'w' , edgecolor = 'k' , frameon = 'True' )
sns .set_style ("whitegrid" )
#box_plot
plt .subplot (1 , 2 , 1 )
sns .boxplot (x = 'loan_status' , y = 'loan_amnt' , palette = 'BrBG' , data = loan )
plt .title ("Distribution of loan amount across Loan Statuses" )Text(0.5, 1.0, 'Distribution of loan amount across Loan Statuses')
Distribution of Annual Income across Loan Statuses #Distribution of Annual Income across Statuses
plt .figure (figsize = (10 , 6 ), dpi = 80 , facecolor = 'w' , edgecolor = 'k' , frameon = 'True' )
sns .set_style ("whitegrid" )
# subplot 1: box_plot
plt .subplot (1 , 2 , 1 )
sns .boxplot (loan ['loan_status' ], loan ['annual_inc' ][loan ['annual_inc' ] < loan ['annual_inc' ].quantile (0.96 )], palette = 'BrBG' )
plt .title ("Distribution of Annual Income across Loan Statuses" )D:\HP\Anaconda3\envs\AI\lib\site-packages\seaborn\_decorators.py:43: FutureWarning: Pass the following variables as keyword args: x, y. From version 0.12, the only valid positional argument will be `data`, and passing other arguments without an explicit keyword will result in an error or misinterpretation.
FutureWarning
Text(0.5, 1.0, 'Distribution of Annual Income across Loan Statuses')
#Variation of loan amount with annual income
plt .figure (figsize = (20 , 20 ))
charged_off_loan = loan .loc [(loan ['loan_status' ]== 'Charged Off' )]#[['loan_amnt','annual_inc']]
sns .pairplot (charged_off_loan , vars = ['loan_amnt' ,'annual_inc' ], size = 5 )
plt .show ()D:\HP\Anaconda3\envs\AI\lib\site-packages\seaborn\axisgrid.py:1912: UserWarning: The `size` parameter has been renamed to `height`; please update your code.
warnings.warn(msg, UserWarning)
<Figure size 1440x1440 with 0 Axes>
Correlation of some importamt variables of interest cor = charged_off_loan [['loan_amnt' ,'funded_amnt' , 'int_rate' , 'installment' ,'annual_inc' ,'dti' ,'open_acc' ,'pub_rec' ]].corr ()
round (cor , 2 )
<style scoped>
.dataframe tbody tr th:only-of-type {
vertical-align: middle;
}
.dataframe tbody tr th {
    vertical-align: top;
}

.dataframe thead th {
    text-align: right;
}
</style>
loan_amnt
funded_amnt
int_rate
installment
annual_inc
dti
open_acc
pub_rec
loan_amnt
1.00
0.98
0.35
0.93
0.35
0.06
0.18
-0.05
funded_amnt
0.98
1.00
0.35
0.95
0.35
0.06
0.18
-0.05
int_rate
0.35
0.35
1.00
0.33
0.13
0.04
0.04
0.08
installment
0.93
0.95
0.33
1.00
0.36
0.04
0.18
-0.04
annual_inc
0.35
0.35
0.13
0.36
1.00
-0.09
0.21
-0.01
dti
0.06
0.06
0.04
0.04
-0.09
1.00
0.30
0.01
open_acc
0.18
0.18
0.04
0.18
0.21
0.30
1.00
0.05
pub_rec
-0.05
-0.05
0.08
-0.04
-0.01
0.01
0.05
1.00
plt .figure (figsize = (15 ,10 ))
# heatmap
sns .heatmap (cor , cmap = "YlGnBu" , annot = True )
plt .show ()
#Loan amount count over the years
plt .figure (figsize = (10 ,5 ))
loan .groupby ('issue_d_year' ).loan_amnt .count ().plot (kind = 'line' , fontsize = 7 )
plt .show ()
#Average Loan amount over the years
plt .figure (figsize = (10 ,5 ))
loan .groupby ('issue_d_year' ).loan_amnt .mean ().plot (kind = 'line' , fontsize = 7 )
plt .show ()
#Distribution of loan amount over Grade
loan .boxplot (column = 'loan_amnt' , by = 'grade' )
plt .show ()
It seems that apparently lower grade is given to Large loan amounts.
Its very evident from graph that as median loan amount increases corresponding grades given are decreasing
#Distribution of annual income over Grade
loan .loc [loan ['annual_inc' ]< 260000 ].boxplot (column = 'annual_inc' , by = 'grade' )
plt .show ()
sns .barplot (x = 'verification_status' , y = 'loan_amnt' , hue = "loan_status" , data = loan , estimator = np .mean )<AxesSubplot:xlabel='verification_status', ylabel='loan_amnt'>
Higher loan amounts are Verified more often.
Higher loan amounts are riskier and are also verified more often.
#Interest vs Term
loan .boxplot (column = 'int_rate' , by = 'term' )
plt .show ()
Seems like large amounts are having longer term and hece the intrest associated with them is also high.
#Loan Status vs Int rate
loan .boxplot (column = 'int_rate' , by = 'loan_status' ,figsize = (7 ,5 ))<AxesSubplot:title={'center':'int_rate'}, xlabel='loan_status'>
Seems like Loans at a higher intrest rate are more likely to be defaulted.
sns .jointplot ('dti' , 'int_rate' , loan )D:\HP\Anaconda3\envs\AI\lib\site-packages\seaborn\_decorators.py:43: FutureWarning: Pass the following variables as keyword args: x, y, data. From version 0.12, the only valid positional argument will be `data`, and passing other arguments without an explicit keyword will result in an error or misinterpretation.
FutureWarning
<seaborn.axisgrid.JointGrid at 0x27531ae6a08>
sns .jointplot ('int_rate' , 'loan_amnt' , loan )D:\HP\Anaconda3\envs\AI\lib\site-packages\seaborn\_decorators.py:43: FutureWarning: Pass the following variables as keyword args: x, y, data. From version 0.12, the only valid positional argument will be `data`, and passing other arguments without an explicit keyword will result in an error or misinterpretation.
FutureWarning
<seaborn.axisgrid.JointGrid at 0x27532542f08>
