theme_ib: A simple ggplot2 theme in my personal style. By
default (plots_pane = FALSE), the theme adjusts the text sizes for
printing images with width 10+ inches & height 8+ inches. plots_pane = TRUE is meant to be used when viewing plots in the plots pane and text
sizes are not adjusted. There is also an option (md = TRUE) to use
markdown theme elements from ggtext instead of element_text(). The
fonts used are IBM Plex Sans & IBM Plex Mono, to load them you need
extrafont and to run extrafont::loadfonts(device = "win", quiet = TRUE) if you’re using Windows.
update_geom_fonts_ib: Update font defaults for text geoms to match
theme_ib
scale_x_c_ib: Sets default values for the expand argument of
scale_x_continuous that adds 0.5 units of space on both sides of the
plot
scale_x_d_ib: Sets default values for the expand argument of
scale_x_discrete that adds 0.5 units of space on both sides of the
plot
scale_y_c_ib: Sets default values for the expand argument of
scale_y_continuous such that there is no space below the lowest value
and the top end of the plot is extended by 5% (eg. for use with bar
plots)
scale_y_d_ib: Sets default values for the expand argument of
scale_y_discrete such that there is no space below the lowest value
and the top end of the plot is extended by 5% (eg. for use with bar
plots)
The following plots were taken from Allison
Horst’s palmerpenguins
README.
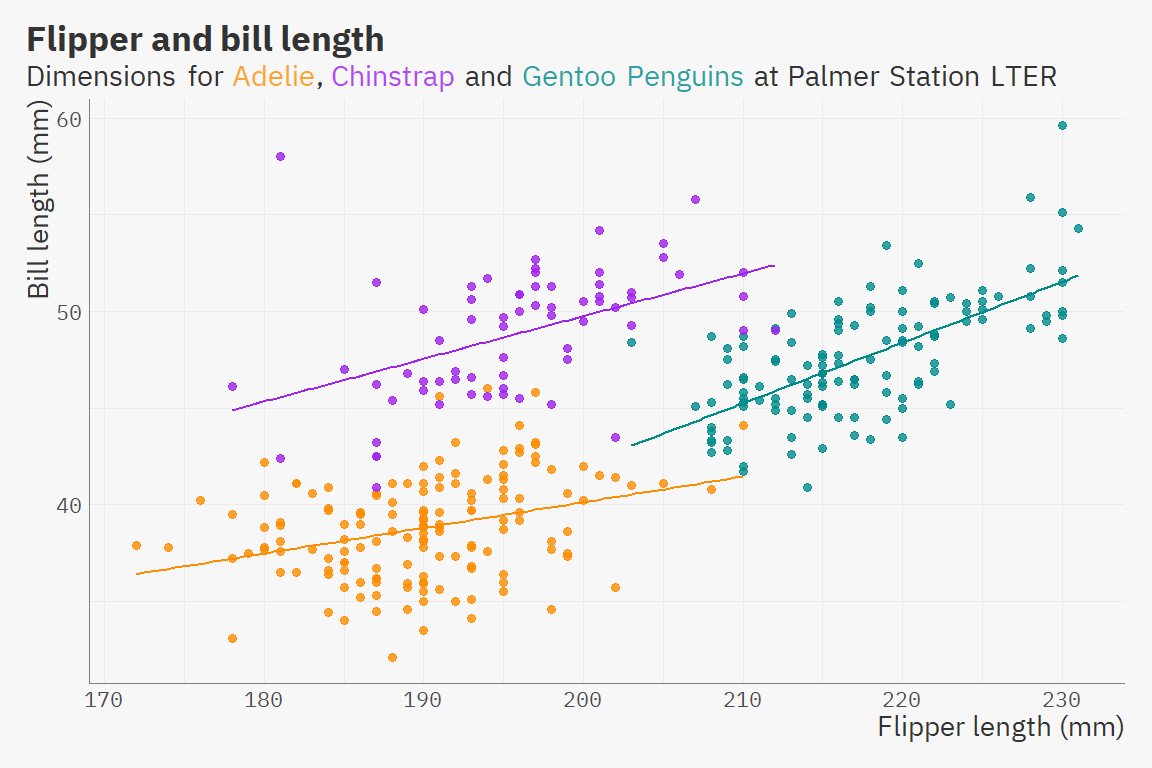
Using theme_ib to print a scatter plot with width = 12 inches & height
= 8 inches and the md = TRUE argument to use
ggtext::element_markdown() instead of element_text() for text
elements, in this case the subtitle:
library(ggplot2)
library(palmerpenguins)
library(ib)
extrafont::loadfonts(device = "win", quiet = TRUE) ## to load the font

ggplot(data = penguins,
       aes(x = flipper_length_mm,
           y = bill_length_mm)) +
  geom_point(aes(color = species),
             size = 3,
             alpha = 0.8, show.legend = FALSE) +
  geom_smooth(method = "lm", se = FALSE, aes(color = species), show.legend = FALSE) +
  scale_color_manual(values = c("darkorange","purple","cyan4")) +
  labs(title = "Flipper and bill length",
       subtitle = "Dimensions for <span style = 'color:#FDA131;'>Adelie</span>, <span style = 'color:#B14AF1;'>Chinstrap</span> and <span style = 'color:#31A0A0;'>Gentoo Penguins</span> at Palmer Station LTER",
  x = "Flipper length (mm)",
y = "Bill length (mm)",
color = "Penguin species") +
  theme_ib(md = TRUE) +
ggsave("flipper_bill.png",device = "png", type = "cairo", width = 12, height = 8, dpi = 300)ggplot(data = penguins, aes(x = flipper_length_mm)) +
geom_histogram(aes(fill = species),
alpha = 0.5,
position = "identity") +
scale_fill_manual(values = c("darkorange","purple","cyan4")) +
labs(title = "Penguin flipper lengths",
x = "Flipper length (mm)",
y = "Frequency",
fill = "Penguin species") +
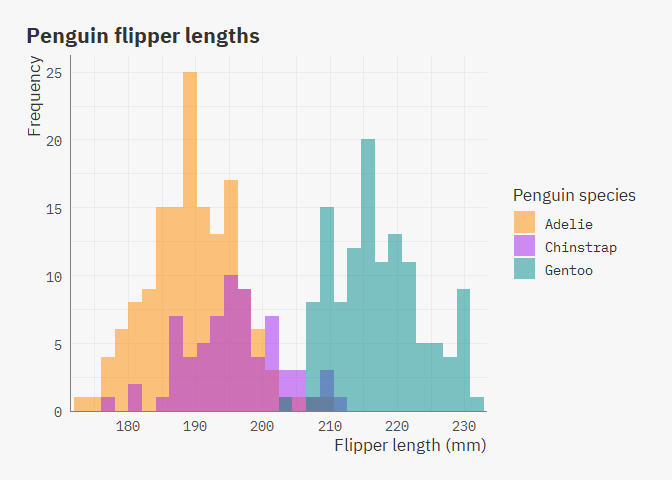
theme_ib(plots_pane = TRUE) +
scale_x_c_ib() +
scale_y_c_ib()
