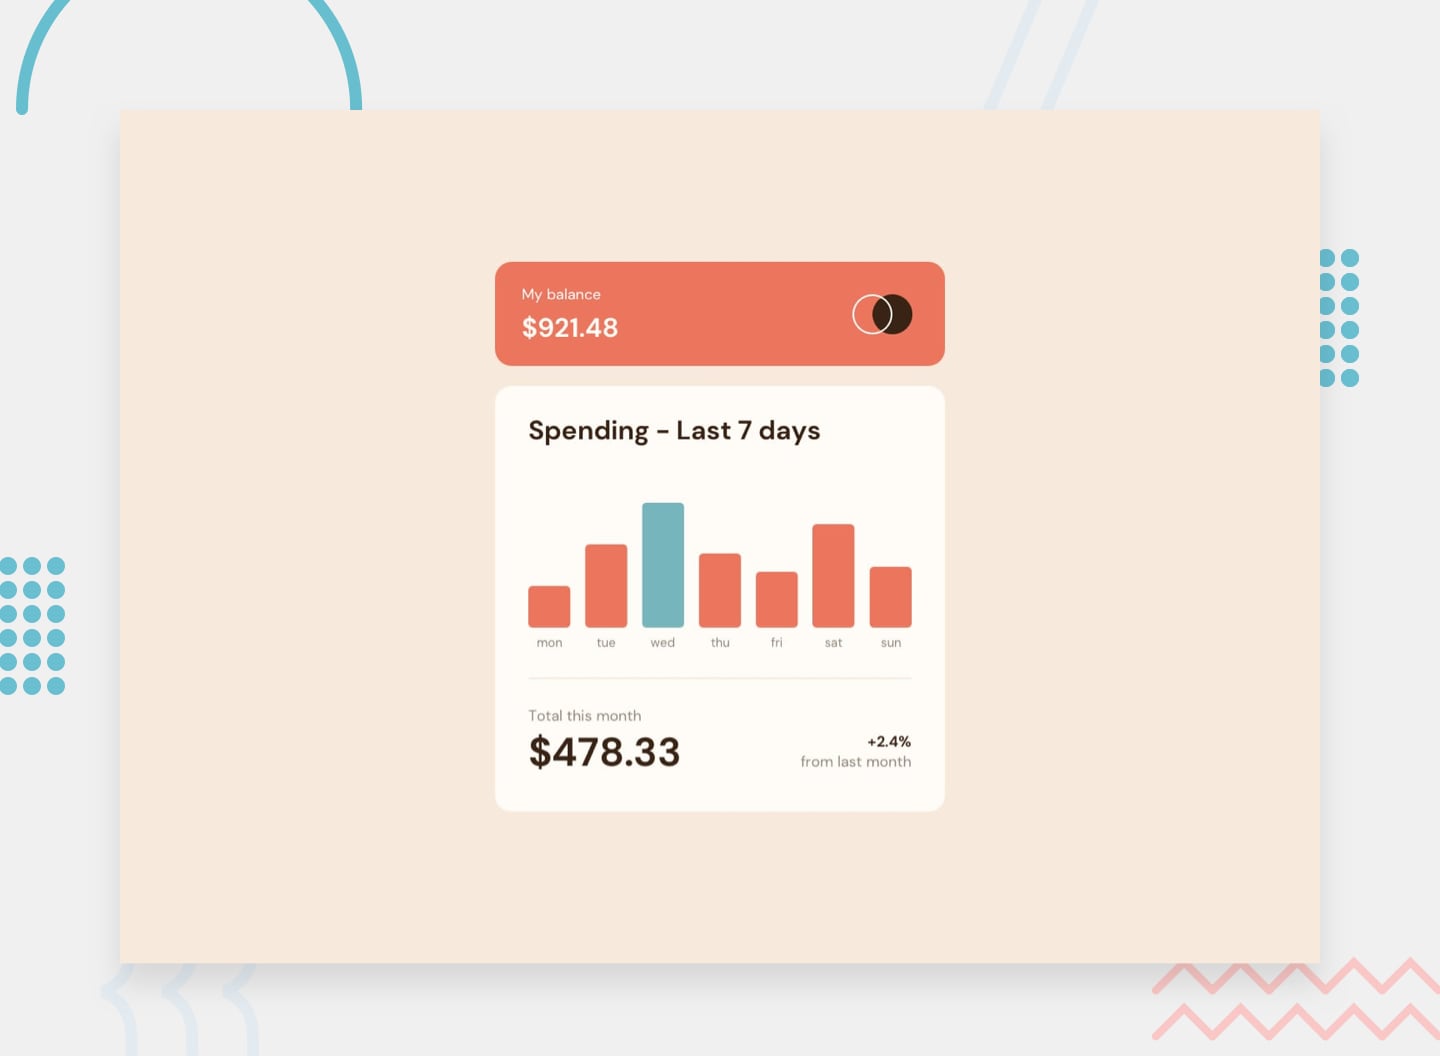
Users should be able to:
- View the bar chart and hover over the individual bars to see the correct amounts for each day
- See the current day’s bar highlighted in a different colour to the other bars
- View the optimal layout for the content depending on their device’s screen size
- See hover states for all interactive elements on the page
- Bonus: Use the JSON data file provided to dynamically size the bars on the chart
- Solution URL: Solution URL here
- Live Site URL: Live site URL here
- Semantic HTML5 markup
- CSS custom properties
- Flexbox
- CSS Grid
- Mobile-first workflow
fetch("data.json")
    .then((Response) => Response.json())
    .then((jsonData) => {});
};I want to refine my web development skills, become more adaptable with different technologies, libraries, and frameworks with the changing world. My main objective is to get involved more & more so that ultimately I can have a good grip of web development.
- Frontend Mentor - @iprinceroyy
- Twitter - @prince_popups
