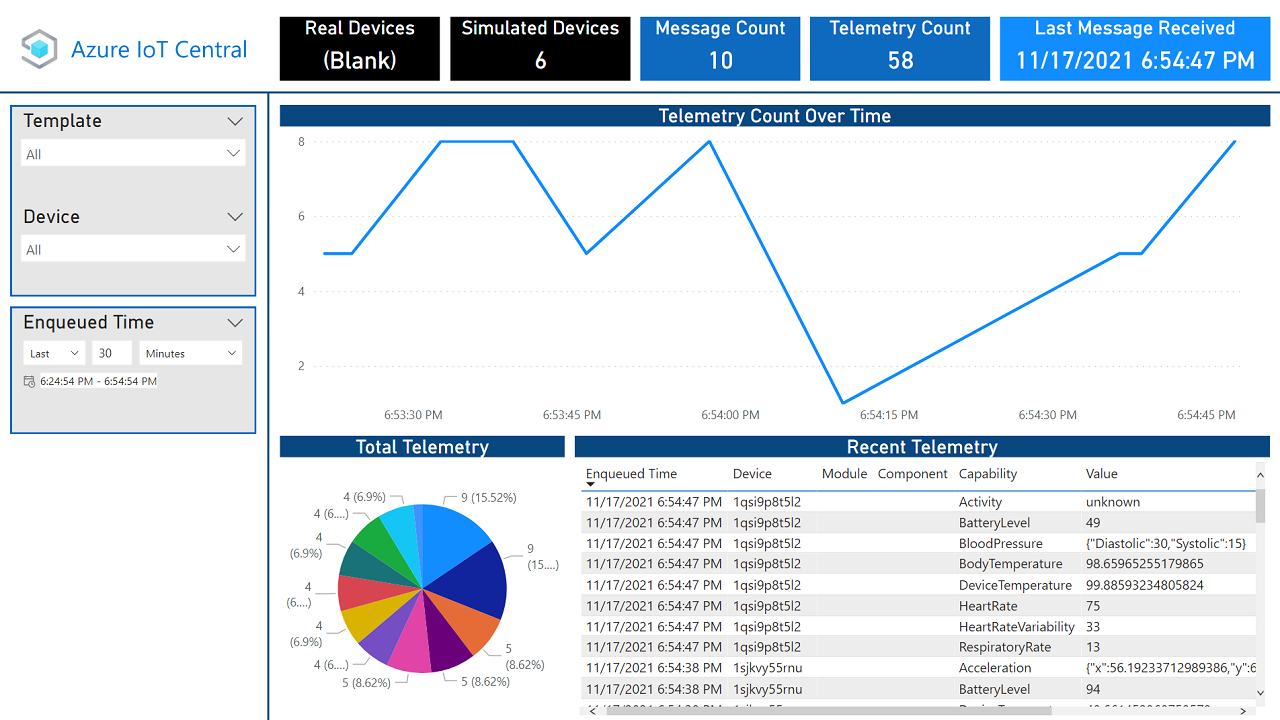
This project allows you to create a powerful Power BI dashboard to monitor the performance of the IoT devices in your Azure IoT Central V3 application. By running a single script, you can set up an end-to-end solution that exports your device telemetry data into an Azure Data Explorer table and creates a Power BI dashboard that you can use to:
- Track how much data your devices are sending over time
- Identify devices that are reporting lots of measurements
- Observe historical trends of device measurements
- Identify problematic devices that send lots of critical events
The Power BI solution for Azure IoT Central V3 creates an Azure Data Explorer cluster in your Azure subscription which connects to the included Power BI desktop template file. Whether you want to see an example architecture, get up and running quickly with IoT Central and Power BI, or customize the script for your own solution, this project is a great starting point for integrating IoT Central with Azure Data Explorer and Power BI.
- An IoT Central application, with real or simulated devices, for which you have permissions to configure data exports.
- A Linux shell environment with
Azure CLI:
- You can use Azure Cloud Shell, which already has Azure CLI installed (recommended).
- You can follow the installations instructions here to install Azure CLI on a Linux or WSL environment.
- Run
az loginto authenticate to Azure CLI.- API authentication requires authentication from your home tenant. After
logging in, you can switch to your home tenant via the following command if
necessary:
az login --tenant $(az account show --query homeTenantId -o tsv)
- API authentication requires authentication from your home tenant. After
logging in, you can switch to your home tenant via the following command if
necessary:
- Copy the
setupscript into your environment and run it (arguments described below).- Example:
setup -a <your application> -c <your ADX cluster> -d <your ADX database> - If you get a "permission denied" error, you may need to run
chmod +x setupin order to give the script execution permissions.
- Example:
- Open the
IoT Central Power BI SolutionPower BI template file, and enter the same ADX cluster, database, and table provided in step 2. Note that it may take a few minutes for data to start flowing into the dashboard.
The following are the available arguments for the setup script:
--application(-a) [required]: Name of the IoT Central application.--cluster(-c) [required]: Name of the ADX cluster.--database(-d) [required]: Name of the the ADX database.--resource-group(-g): Name of the resource group; defaults to the Azure CLI configured default or to the application's resource group, in that order.--subscription(-s): Name or ID of the subscription; defaults to the account currently logged into Azure CLI.--table(-t): Name of the ADX table; defaults to "Telemetry".
The following resources are provisioned in the given subscription by the setup
script:
- An ADX cluster (Standard_E16a_v4) and database, if the script is provided with ones that do not already exist.
- An ADX table in the provided database, with a schema appropriate for Power BI ingestion.
- A service principal used to connect IoT Central with the ADX database.
- An IoT Central data export and ADX destination with an appropriate transformation for the ADX table's schema. You can learn more about IoT Central Data Export here.
If you are interested to know what the setup script is doing (or want to
follow it manually), the required steps are roughly as follows:
- Create any required resources not already present (ADX cluster, database, etc.).
- Create a service principal to connect IoT Central to the ADX database. Note the app/client ID, tenant ID, and password/secret, since they will be needed below.
- Wait a minute for the service principal to propagate, then add it to the ADX database.
- Create a table in the ADX database with a star schema (a.k.a. a flattened list of metadata along with the value), and enable streaming ingestion on the table. The schema created by the script is as follows:
Message:string,
EnqueuedTime:datetime,
Application:string,
Device:string,
Simulated:boolean,
Template:string,
Module:string,
Component:string,
Capability:string,
Value:dynamic
- Create an ADX destination for IoT Central data export, using the service principal created above.
- Create a telemetry data export, and connect it to the above destination with an appropriate jq transformation for the table's schema. The transform created by the script is as follows:
import "iotc" as iotc;
iotc::uuid as $id | . as $in | .telemetry[] | {
    Message: $id,
    EnqueuedTime: $in.enqueuedTime,
    Application: $in.applicationId,
    Device: $in.device.id,
    Simulated: $in.device.simulated,
    Template: ($in.device.templateName // ""),
    Module: ($in.module // ""),
    Component: ($in.component // ""),
    Capability: .name,
    Value: .value
}
