Single cell RNA-Seq analysis with quantitative phenotypes.
Examples:
Hosted on readthedocs.
The vision is to let you explore your data your way while providing support for repetitive tasks. Here a few things I do pretty regularly:
- quality control and filtering
- sample and feature filtering (e.g. querying by quantitative phenotypes in certain ranges)
- dataset splitting (e.g. by metadata) and merging
- bootstrapping
- normalization
- log/unlog transform
- summary statistics (mean expression, std, cv, fano index)
- feature selection
- clustering (e.g. k-means, affinity propagation)
- dimensionality reduction and feature weighting including phenotypes (e.g. PCA, tSNE, umap, SAM)
- k nearest neighbors (knn) graphs
- plotting dimensionality reductions colored by categorical or quantitative metadata
- plotting hierarchical clustering
- correlations of gene expression to gene expression or to quantitative phenotypes
- differential expression at the distribution level (e.g. Mann-Whitney test)
- load/write to loom files
- support for custom plugins to expand the list of features at runtime
Python 3.5+ is required. Moreover, you will need:
Optional dependencies:
- plotting:
- dimensionality reduction/knn graphs:
- I/O of loom files:
Get those from your Linux distribution, pip, conda, or any other source.
Singlet is pure Python for the time being. So it should work on any platform supported by its dependencies, in particular various Linux distributions, recent-ish OSX, and Windows. It is tested on Linux and OSX, but if you are a Windows user and know how to use AppVeyor let's set it up!
To get the latest stable version, use pip:
pip install singletTo get the latest development version, clone the git repo and then call:
python3 setup.py installYou can have a look inside the test folder for examples. To start using the example dataset:
- Set the environment variable
SINGLET_CONFIG_FILENAMEto the location of the example YAML file - Open a Python/IPython shell or a Jupyter notebook and type:
import matplotlib.pyplot as plt
from singlet.dataset import Dataset
ds = Dataset(
    samplesheet='example_PBMC2',
    counts_table='example_PBMC2',
    featuresheet='example_PBMC2',
    )
ds.counts.log(inplace=True)
ds.samplesheet['cluster'] = ds.cluster.kmeans(axis='samples', n_clusters=5)
vs = ds.dimensionality.tsne(perplexity=15)
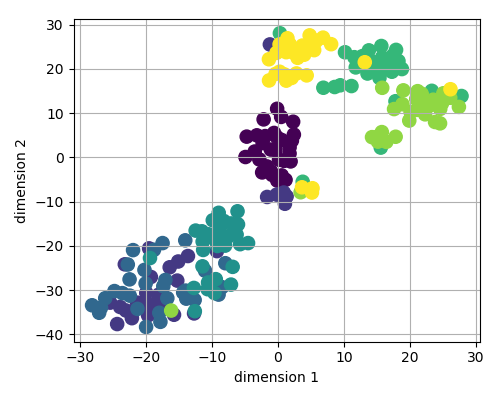
ax = ds.plot.scatter_reduced_samples(
    vs,
    color_by='cellType',
    figsize=(5, 4),
    )
plt.show()
This will calculate a t-SNE embedding of the log-transformed features and then show your samples in the reduced space, colored by cluster. It should look more or less like this:
Singlet is similar to other packages like scanpy or seurat. However, there are differences too:
scanpyfocuses on huge datasets and graphical methods. Singlet is not opinionated about graphs and works best with smaller datasets that include quantitative phenotypes (e.g. single cell size)seuratfocuses on emanating a simple user experience. Singlet does try to take over repetitive tasks (e.g. data filtering) but refuses to perform strongly opinionated operations without explicit user consent (e.g. normalization using a particular statistical model).singlettries to use object oriented programming to keep clean interfaces and has an open plugin structure.


