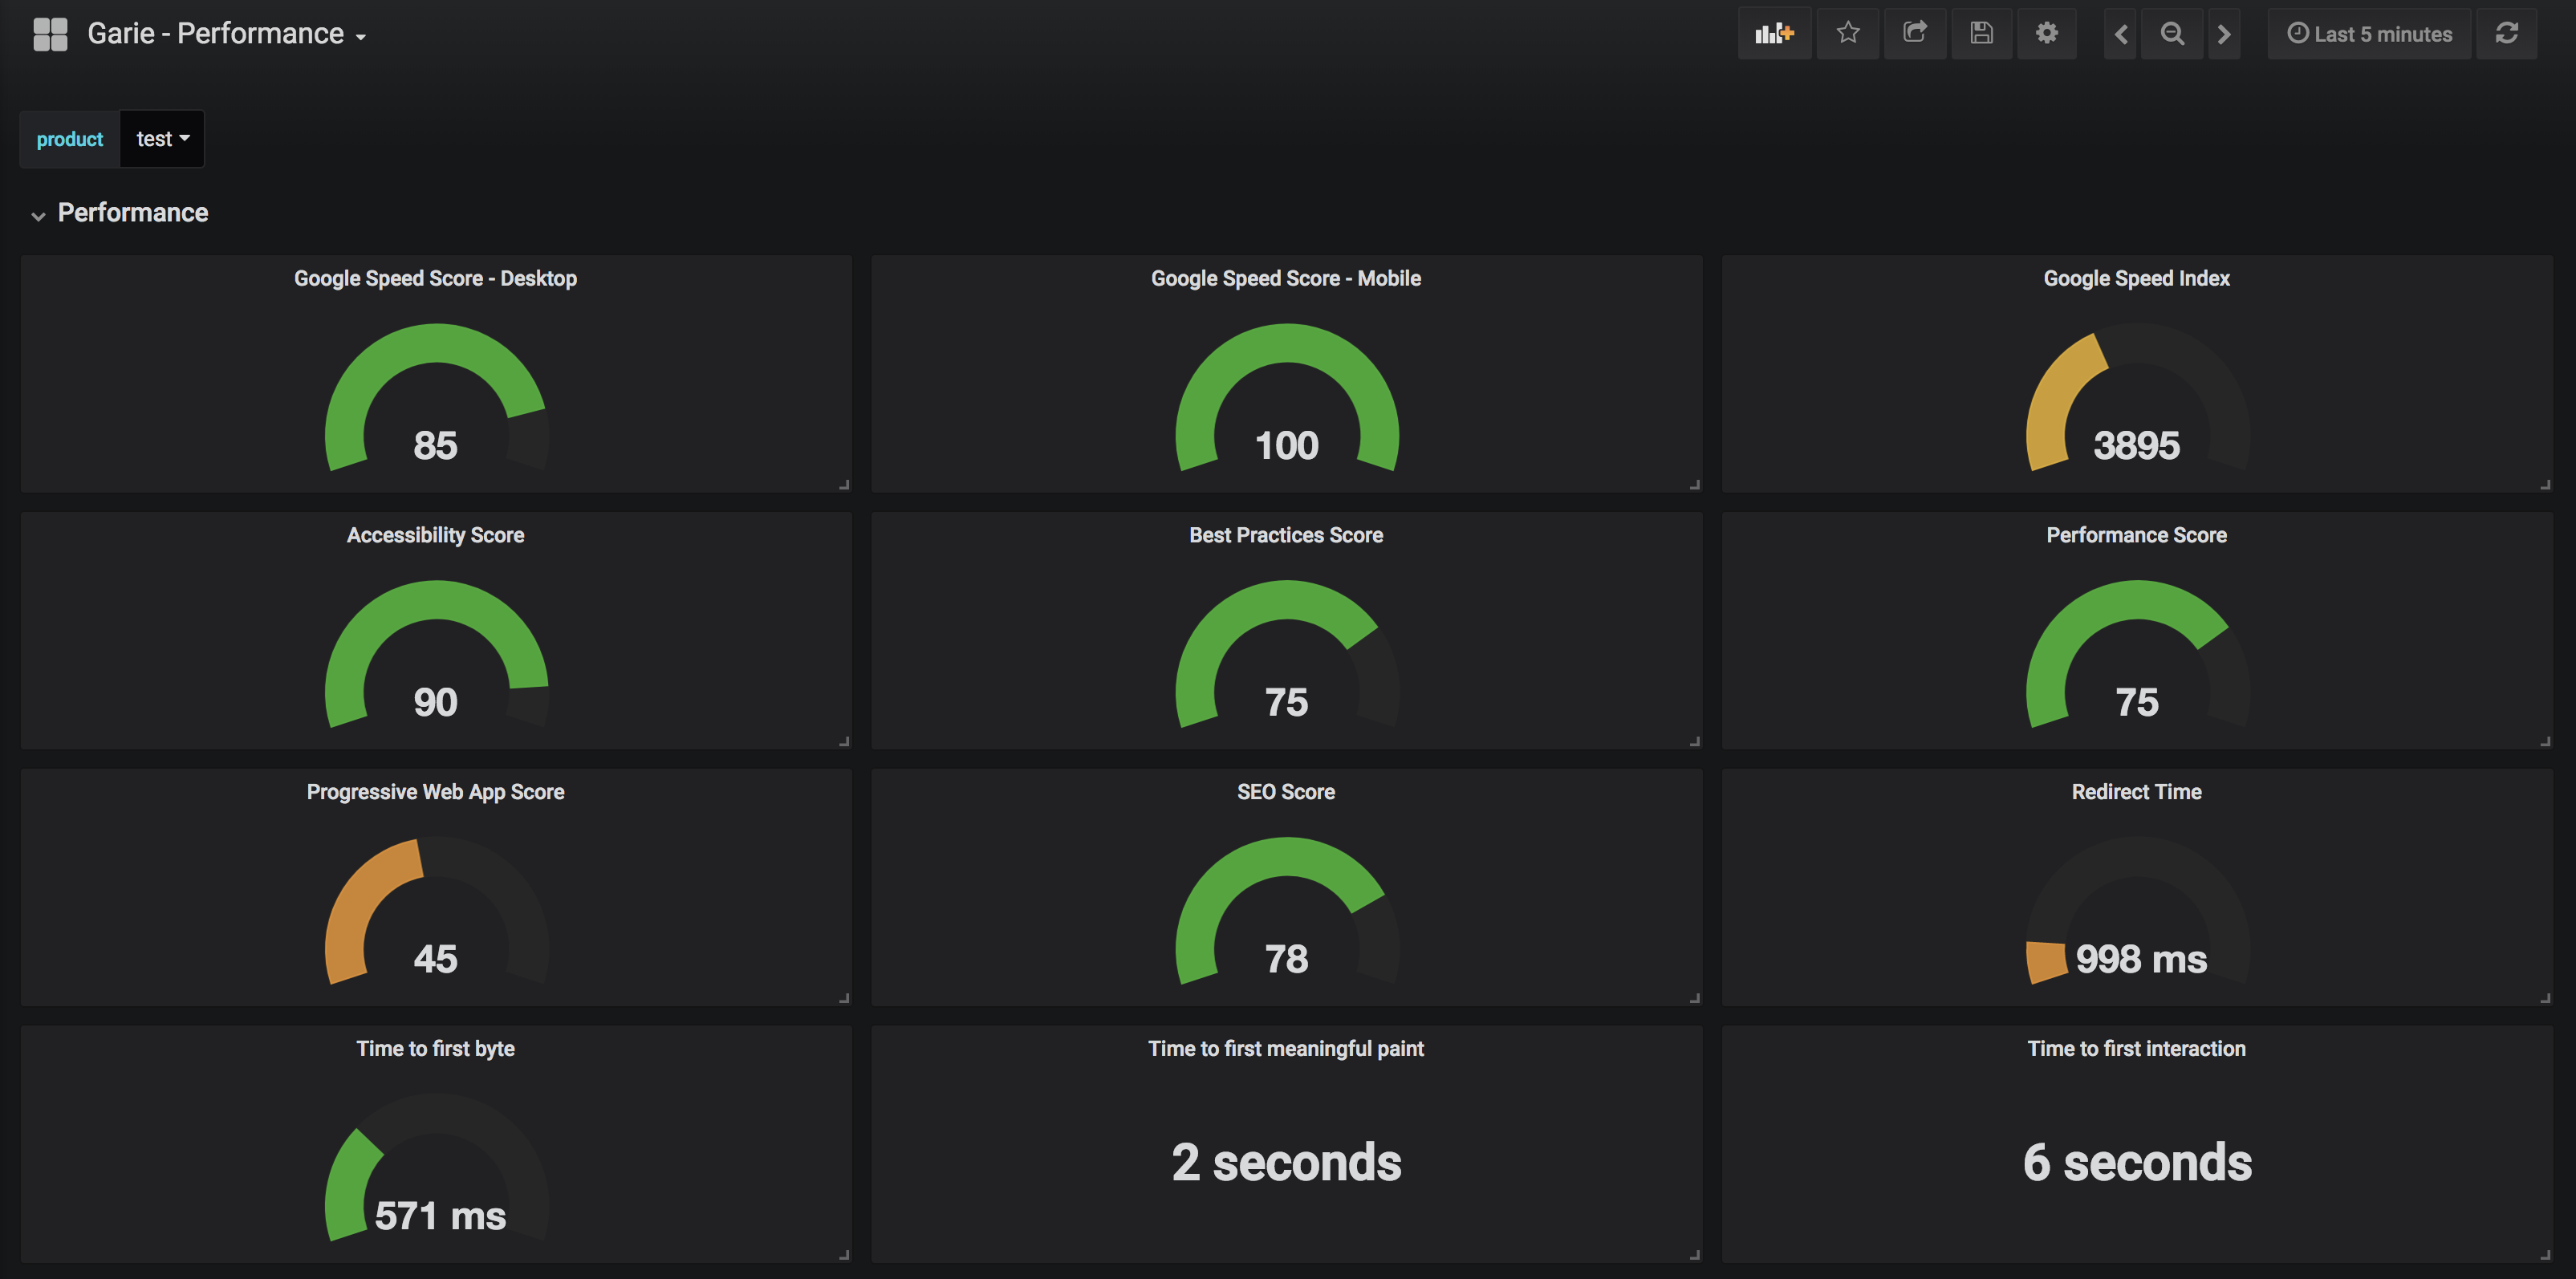
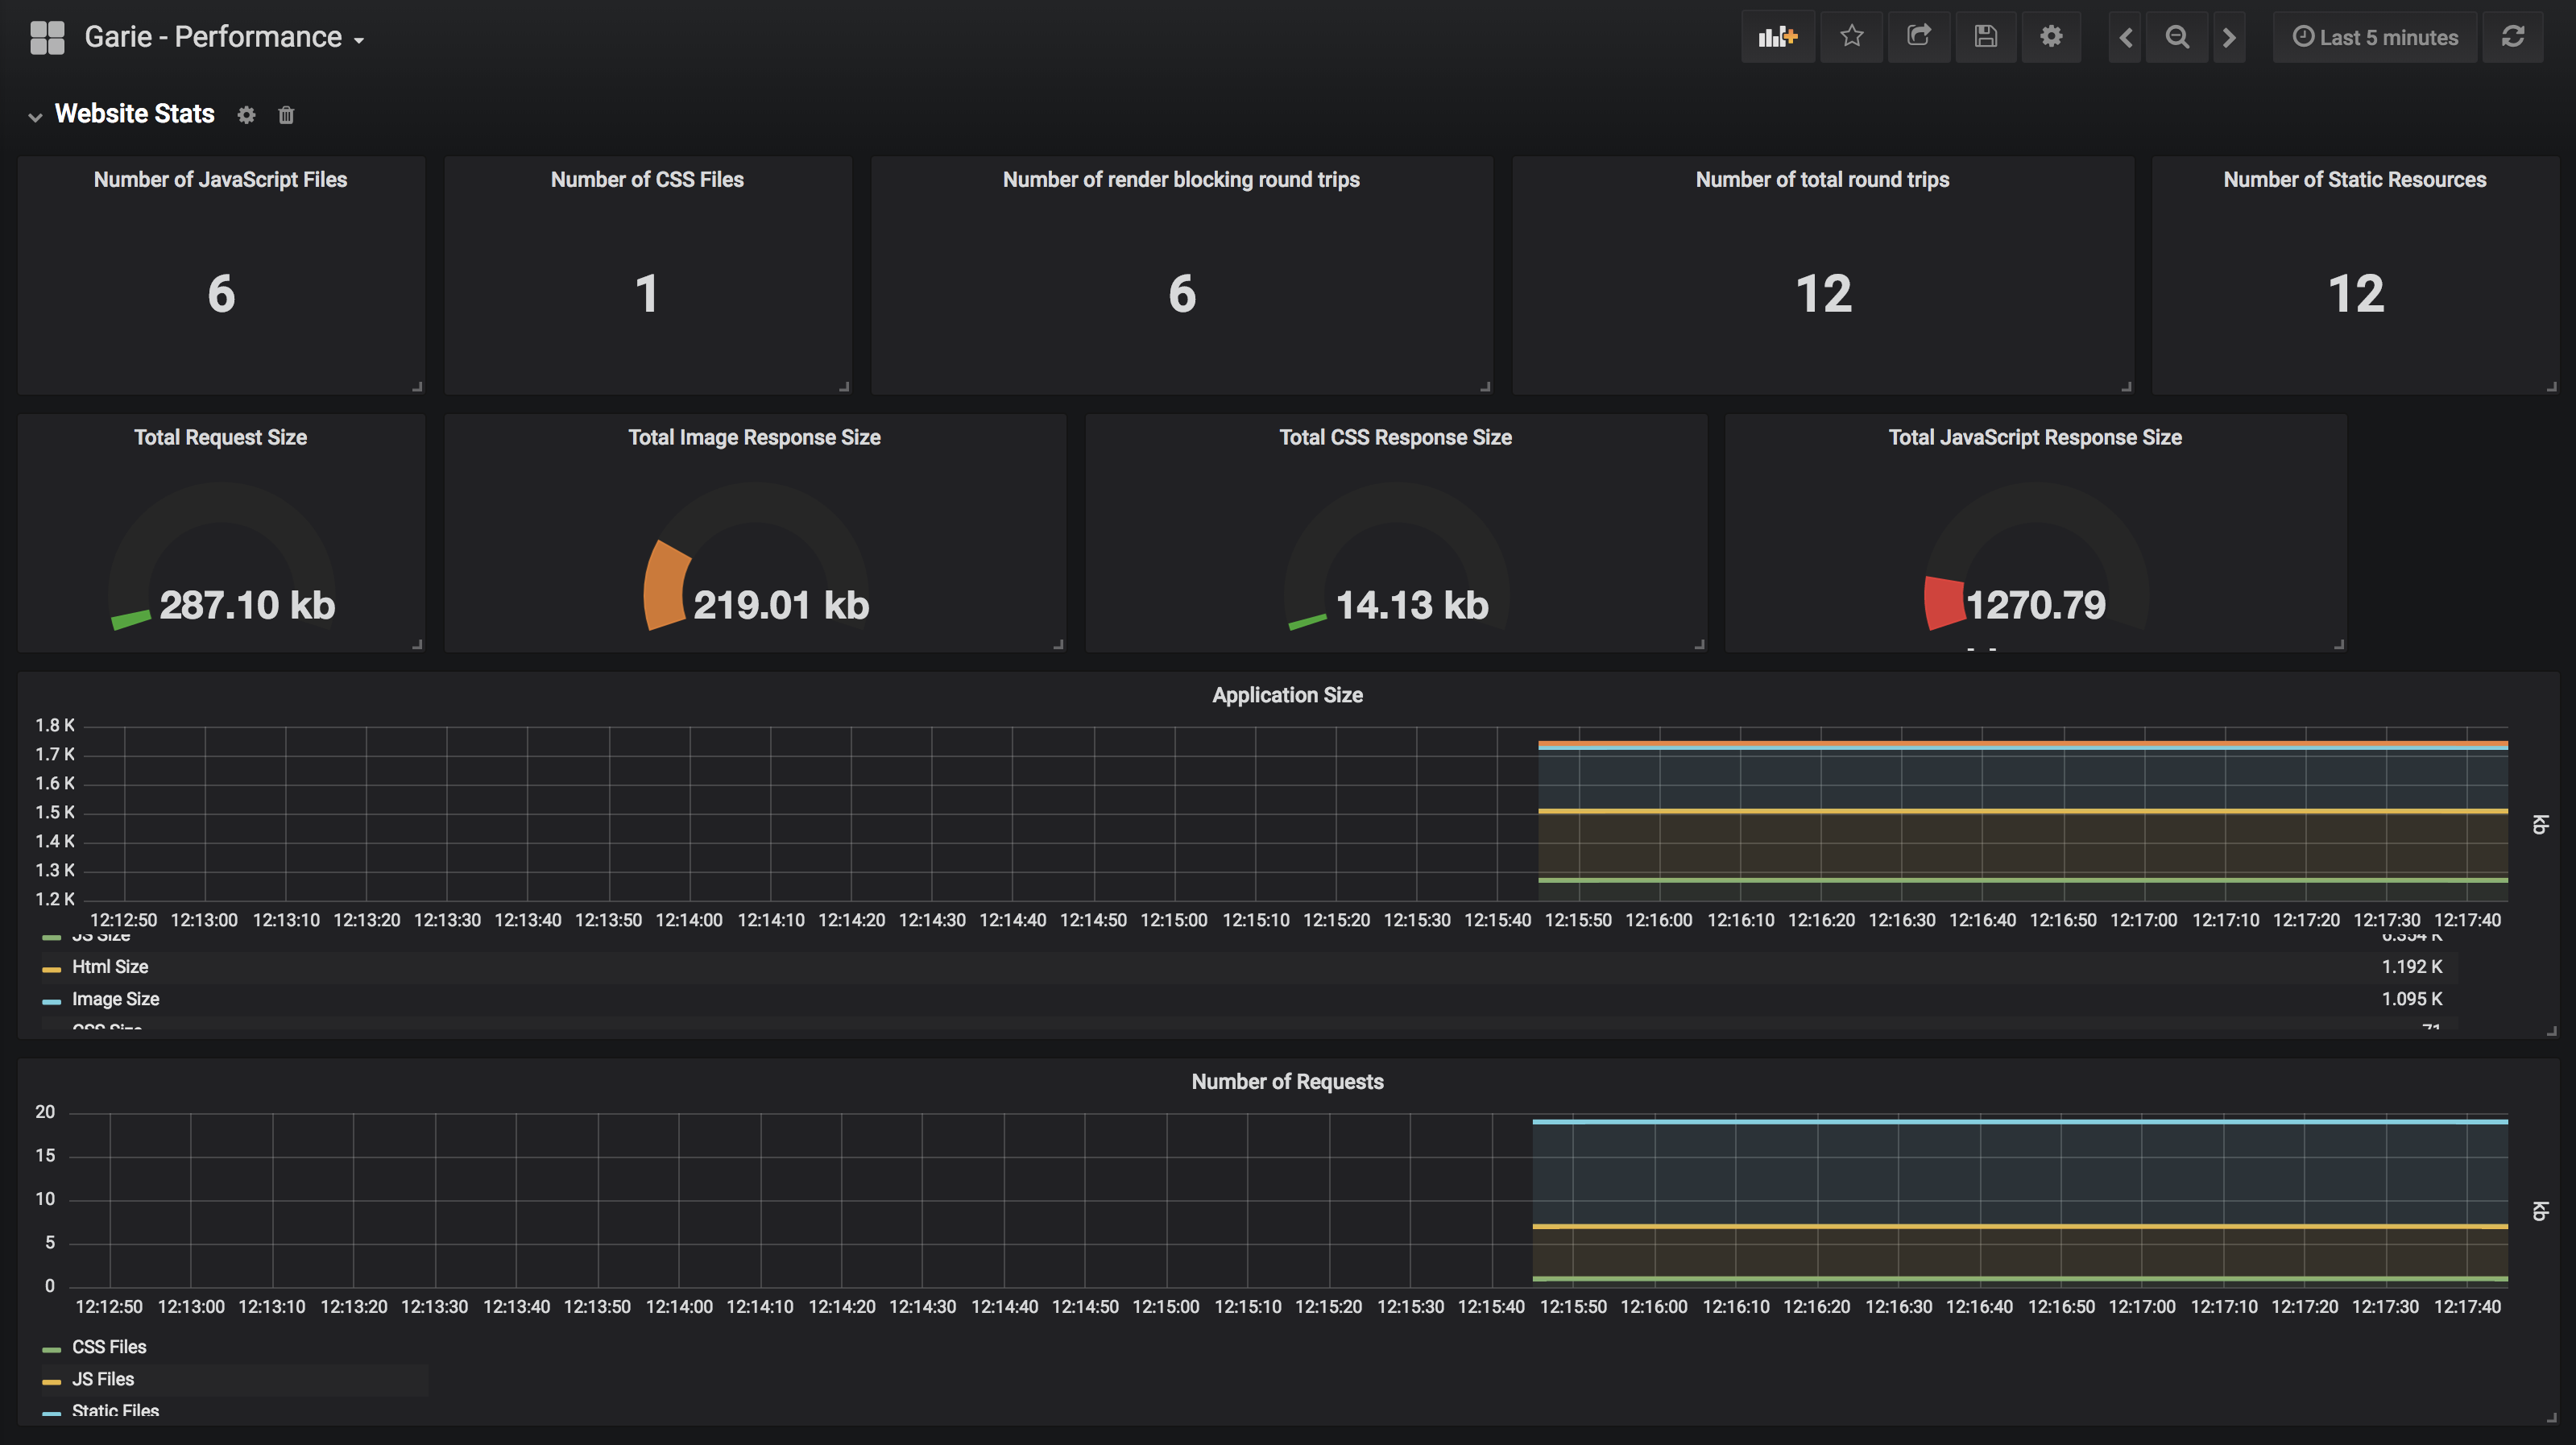
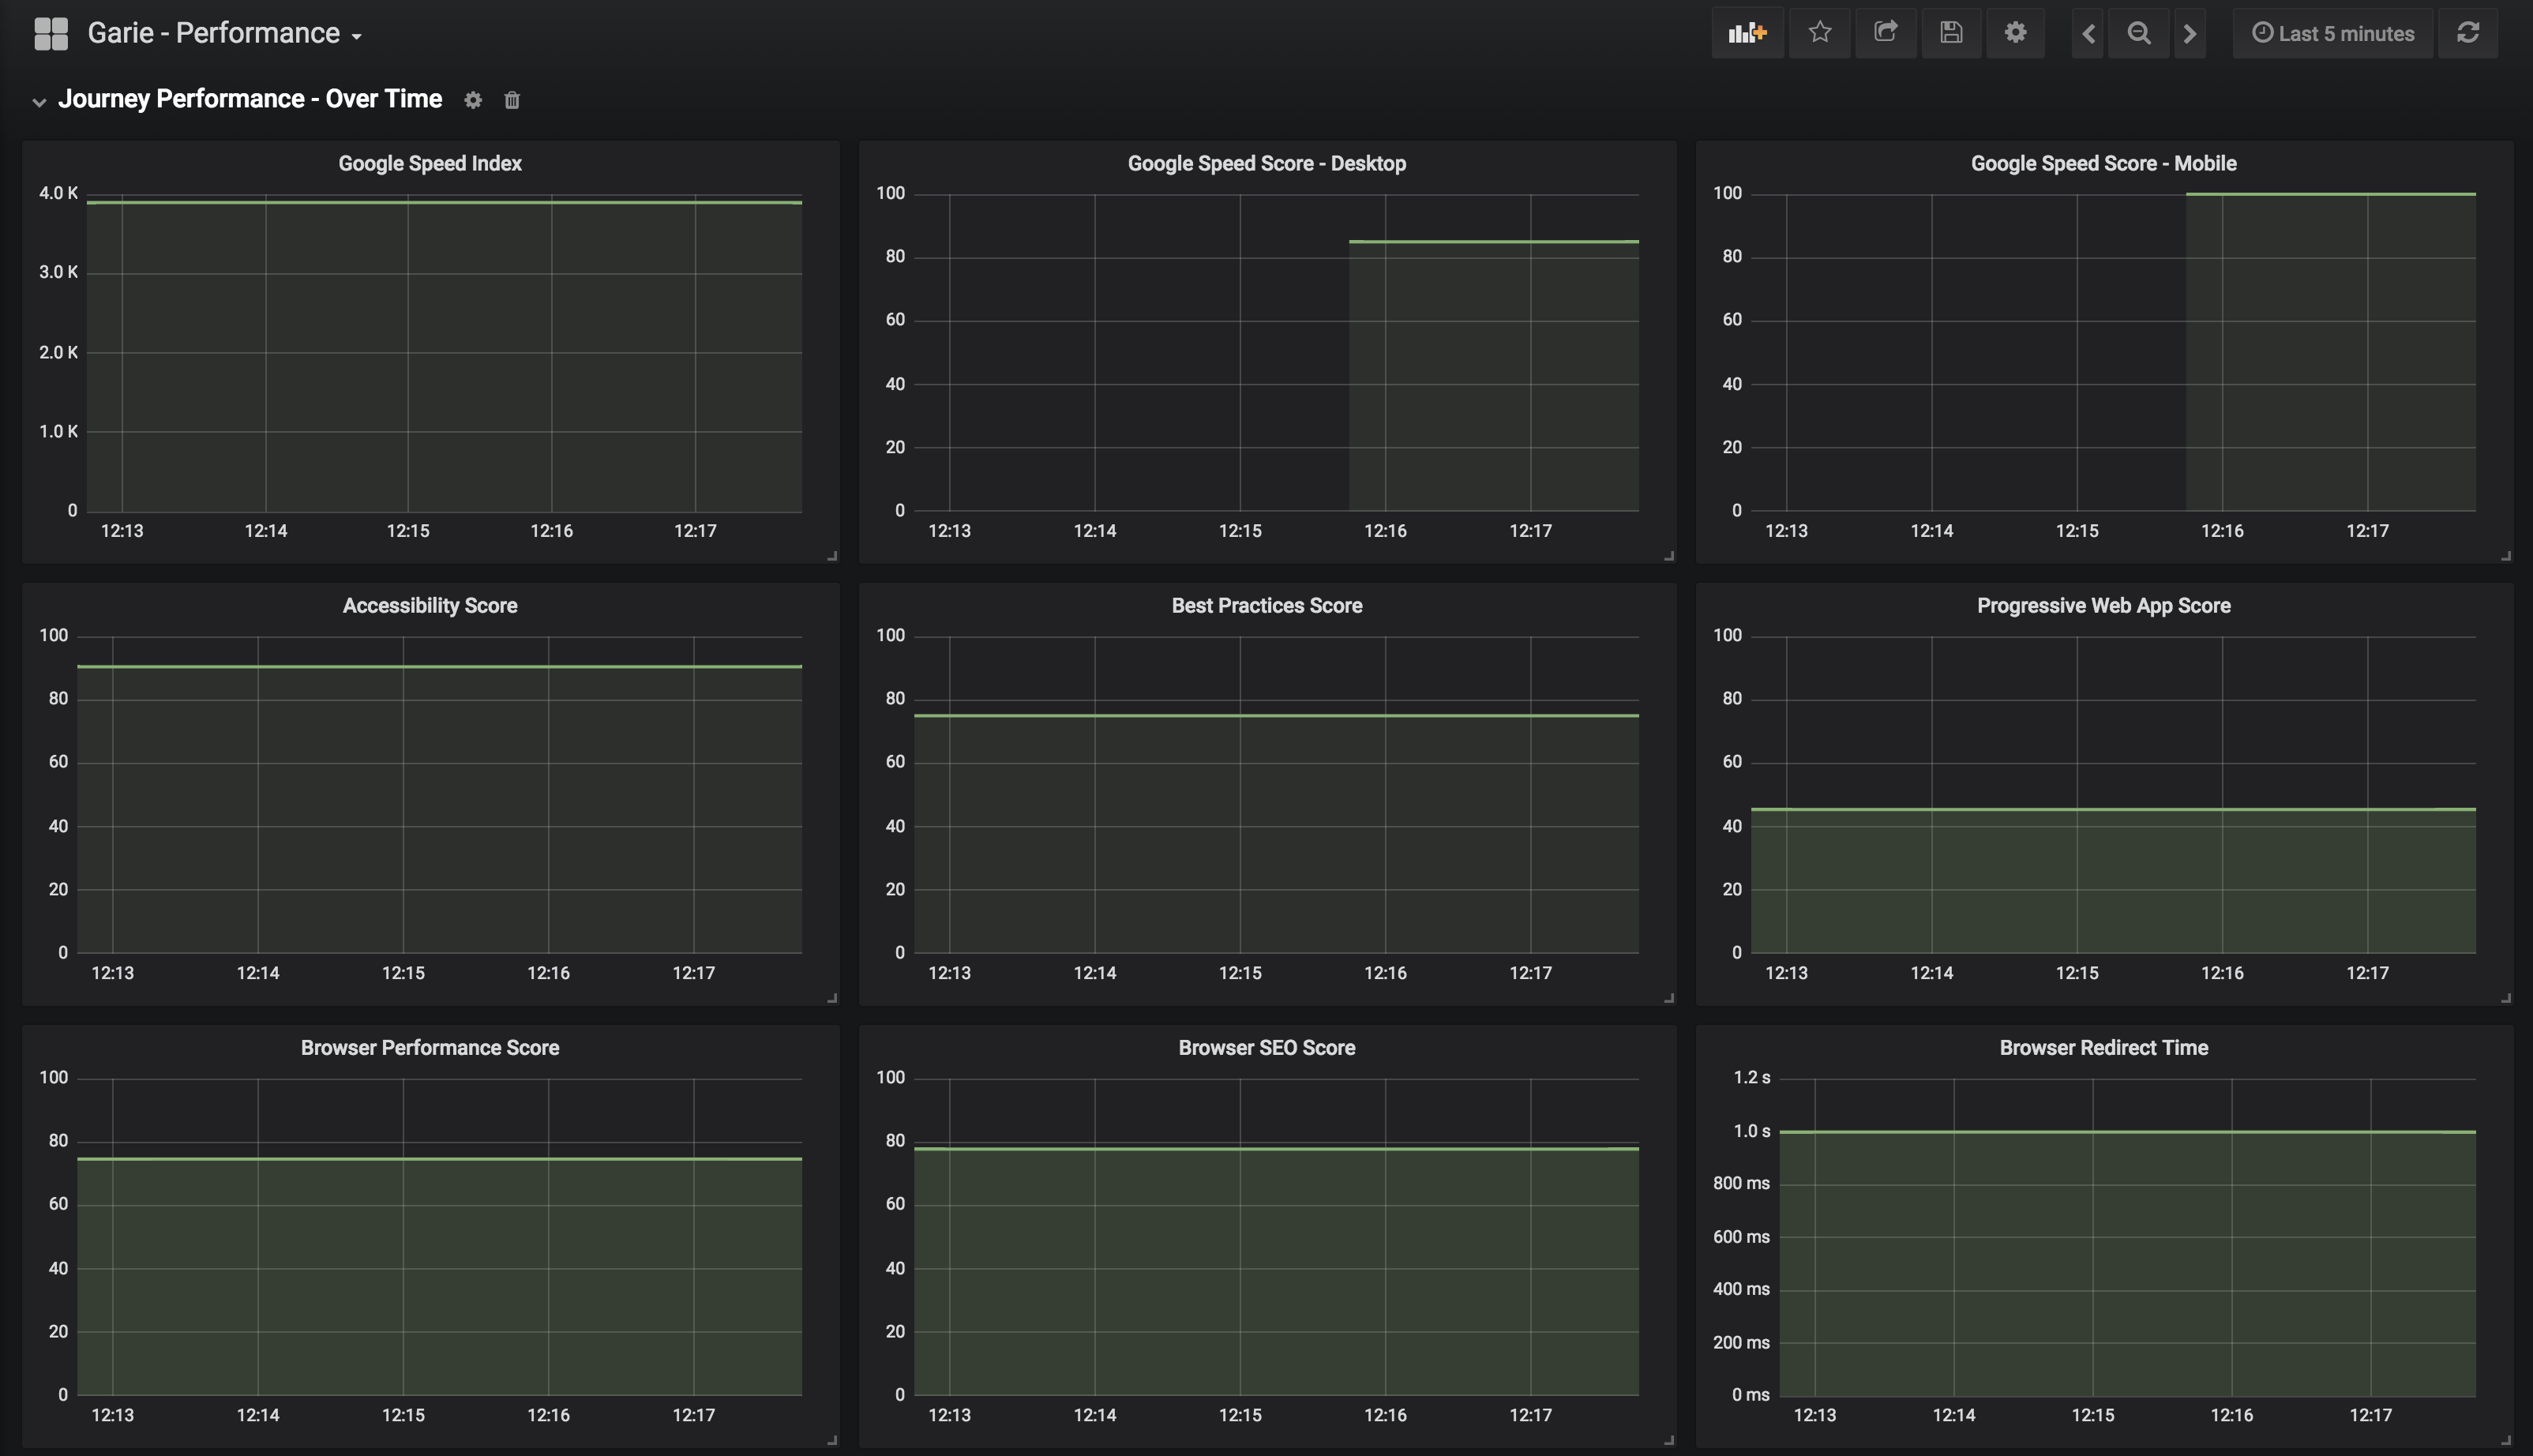
Garie is a open source tool for monitoring web performance using promethus and graphna. Garie integrated with lighthouse and page speed insights to gather performance metrics then logs them into promethesus.
Highlights
- Setup everything with one command.
- Out the box dashboards.
- View performance data over time.
- Integrated with Lighthouse, Page-speed-insights
Garie is a simple express server sat ontop of multiple docker containers to collect performance data through multiple performance tools. The data is stored in promethesus and visualised using Grafana.
- Docker and Node 8.10.0 or greater.
- Page speed insights API key
- Lighthouse API key
PAGE_SPEED_INSIGHTS_KEY={PAGE_SPEED_INSIGHTS_KEY} LIGHTHOUSE_API_KEY={LIGHTHOUSE_API_KEY} docker-compose up
Once docker-compose has complete, go to http://localhost to view your dashboard that is already setup and good to go!
- username: admin
- password: secret
You can capture data anyway you want. You could setup a cron job to hit the application every X amount of times to gather information or a github webhook with any release of your software.
- url - The url to get the performance data for.
- product - The product which is used on the dashboards.
Example: http://localhost:8080/lighthouse?url=http://www.google.co.uk&product=google
- url - The url to get the performance data for.
- product - The product which is used on the dashboards.
Example: http://localhost:8080/page-speed-insights?url=http://www.google.co.uk&product=google
You can view your dashboards at http://localhost. You will be asked to login. Please use the credentials below.
- username: admin
- password: secret
| Metric | Description |
|---|---|
| light_house_accessibility | Accessibility score from lighthouse (0/100). |
| light_house_best_practices | Best practices score from lighthouse (0/100) |
| light_house_first_interactive | The time to first interaction (ms) |
| light_house_first_meaningful_paint | The time to first meaningful paint (ms) |
| light_house_performance | Performance score from lighthouse (0/100) |
| light_house_progressive_web_app | Progressive web app score from lighthouse (0/100) |
| light_house_redirects | Number of redirects |
| light_house_seo | SEO Score from lighthouse (0/100) |
| light_house_speed_index_metric | Speed index |
| light_house_time_to_first_byte | Time to first byte (ms) |
| page_speed_insights_page_stats_cssResponseBytes | Total CSS Response in bytes |
| page_speed_insights_page_stats_htmlResponseBytes | Total HTML response in bytes |
| page_speed_insights_page_stats_imageResponseBytes | Total Image response in bytes |
| page_speed_insights_page_stats_javascriptResponseBytes | Total JavaScript response in bytes |
| page_speed_insights_page_stats_numberCssResources | Total CSS response in bytes |
| page_speed_insights_page_stats_numberJsResources | Total number of JavaScript files |
| page_speed_insights_speed_score_desktop | Speed score in desktop |
| page_speed_insights_speed_score_mobile | Speed score in mobile |
You can view any metrics gathered by Garie in the prometheus dashboard.
You can view lighthouse metrics by typing lighthouse_ in the input box. You should see all avalaible lighthouse metics.
You can also see page speed insight metrics by typing page_speed_insights into the input box.


