This is sample code for fetching covid test data from department of health and create some key metrics. Build and tested using python 3.9. See requirements.txt for dependencies.
- There is a lag of 2-3 days before all data isa avaliable at the API provider level.
- Today in context of project means the most recent date data is available ( partial or otherwise). so if the most recent data is as of 03/06/2023, today is = 03/06/2023
- Response returns following metrics
- total_pcr_cumulative (int) : total number of pcr tests conducted as of yesterday. total_results_reported column reports the cumulative tests. this is just the sum of total_results_reported on yesterady.
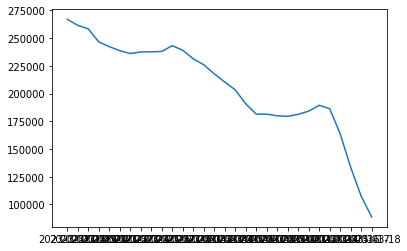
- seven_day_rolling_mean (float, rounded to 2 for readability) : 7 day rolling mean of 'new_results_reported' column. 30 most recent values are returned.
- top_10_states (float ) : top 10 days by positivity rate . where positivity rate = sum of new_results_reported for rows where overall_outcome is 'Positive' / sum of new_results_reported for all outcomes
- Sample response below -
{
  "response": {
    "error": null,
    "metrics": {
      "total_pcr_cumulative": 717406384,
      "seven_day_rolling_mean": {
        "2023-02-07": 299700.86,
        "2023-02-08": 297727.57,
        "2023-02-09": 298017.43,
        "2023-02-10": 296880.86,
        "2023-02-11": 296761.57,
        "2023-02-12": 295095.57,
        "2023-02-13": 292145.86,
        "2023-02-14": 283186.14,
        "2023-02-15": 278128,
        "2023-02-16": 270915.14,
        "2023-02-17": 260545.86,
        "2023-02-18": 254339.29,
        "2023-02-19": 250704,
        "2023-02-20": 238692.86,
        "2023-02-21": 234712.86,
        "2023-02-22": 231228,
        "2023-02-23": 228568.71,
        "2023-02-24": 229693.71,
        "2023-02-25": 229804.43,
        "2023-02-26": 230134.43,
        "2023-02-27": 234651.43,
        "2023-02-28": 228519,
        "2023-03-01": 219504.71,
        "2023-03-02": 212662.43,
        "2023-03-03": 203338.29,
        "2023-03-04": 194765,
        "2023-03-05": 186551.57,
        "2023-03-06": 167536.43,
        "2023-03-07": 140583.29,
        "2023-03-08": 109491
      },
      "top_10_states": {
        "IA": 0.9998428167243005,
        "VI": 0.3054662379421222,
        "SD": 0.2667843548298119,
        "MO": 0.26567030171526906,
        "OK": 0.17905700604662542,
        "ID": 0.1719735182849937,
        "UT": 0.17079457249511168,
        "MS": 0.16314720028807325,
        "MT": 0.15982559013682154,
        "TN": 0.15538280983809297
      }
    }
  }
}
Codebase in the form of a chalice project that can be deployed as an aws lambda or run locally. All of the metric specific logic ( fetching and analysing the data ) is contained in single file ( chalicelib/processor.py).
# insall chalice

python3 -m pip install chalice

# cd to the project directory and run chalice locally

pip install -r requirements.txt

# run tests

pytest tests

#run locally. then visit dev server running at http://127.0.0.1:8000

chalice local
Alternativly, directly run the chalicelib/processor.py (with default parameters that would return desired set of metrics)
pip install -r requirements.txt
cd chalicelib/processor.py
python processor.py
State positivity rate is generally constant within range of 15 - 20% except IA. More investigation is needed to see whether it's a reporting (data ) issue or really high positivity rate.
- better error handling (specially for partial data)
- drop some rows based on bad data definition
- handle NaN (specially returning to chalice). Not tested.
- CI/CD
- Tests