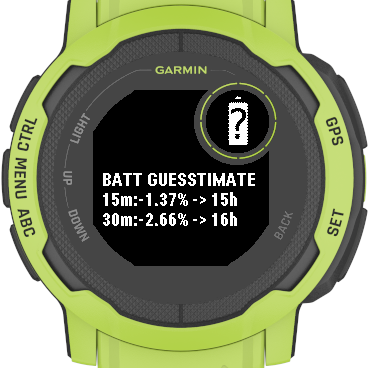
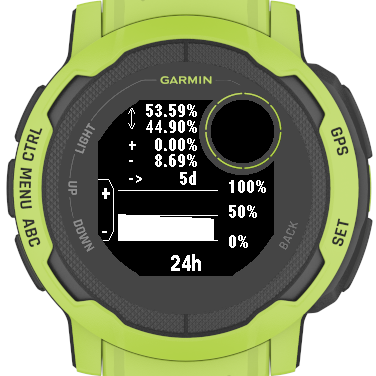
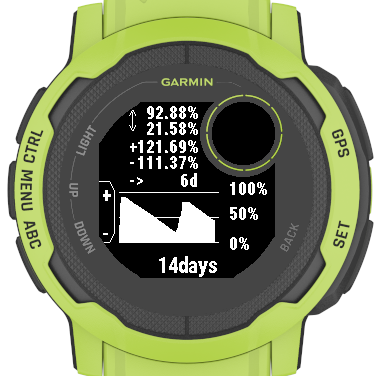
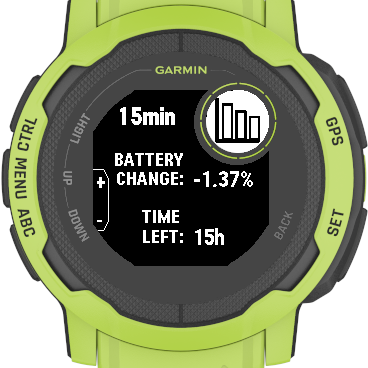
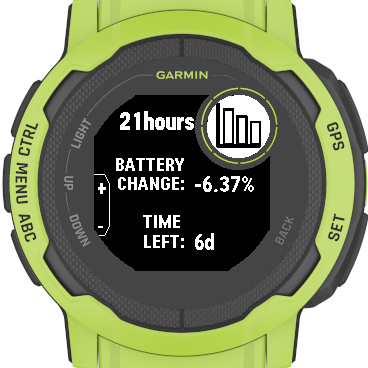
- Shows the battery consumption over time
- Estimates how long the battery would last (better than the build-in estimation)
- Notifies the connected phone when a set threshold is reached during charging (to extend the battery lifetime)
Connect IQ store link: https://apps.garmin.com/en-US/apps/572b8232-7fb6-4e4f-a938-2395d0df3c7c
For questions, please open an issue or contact me on twitter
I don't know exactly how Garmin predicts how long the battery of a watch would last, but I have been unhappy with that prediction. Specially during power-draining activities the battery on my Instinct2 is drained much quicker than predicted. This app tries to solve that problem.
During a longer activity you can check how much battery charge you have lost so far in the last x minutes/hours and see how long your battery would last if you keep on using it the same way.
Also, this app shows you nicely if you have gained any battery charge by solar.
As a small extra the app can help you extend the overall battery lifetime by configuring a charging threshold, so you don't charge the battery to 100% but for e.g. only to 90%.
The battery status is collected every 15min in the background and this date is used to
- show the battery charge/discharge over time
- calculate how long the battery might last
- show a graph of the battery status
- notify the user when the battery reached a specific level during charging (off by default)
- add the app to your glance carousel
- the glance view shows the charge/discharge in the last 15/30 min and prediction based on that data
- in the glance view press the GPS button to view details of different time periods
- in the details view use the UP/DOWN buttons to cycle through the different time periods
- in the details view press the GPS button to view the battery graph
- in the graph view use the UP/DOWN buttons to cycle through the different time periods
- set the charging threshold through the Connect IQ app if you want to receive a notification when the battery reached a specific level during charging
Use the Connect IQ app to configure the widget.
- time-frames to be displayed in the glance view
- charging threshold to send a notification to the connected mobile phone
- export settings
In the glance and the details view the app compares the latest saved battery state to the selected point in time (e.g 24h in the past), it shows the charge/discharge for that period and predicts how long the battery would last assuming a linear discharge for the selected time frame and for the future.
In the graph view the app accumulates all charging and all discharging for that particular time frame, and besides the graph it shows:
- the maximum/minimum charge in the selected time frame
- cumulated charge/discharge for the time frame
- prediction for how long the battery will last given the discharge in the future will be similar to the cumulated discharge for the selected time frame
It depends!
The calculation for the glance view and the details view is very quick, but if you have recharged the battery in between it might be useless. E.g. 14 days ago the battery had 60% charge left, during the next 7 days it got discharged down to 10%, then recharged to 100% and is currently standing at 59%. For the time-frame of 14 days the glance and the details view would only check the oldest and newest data point, seeing 1% of discharge over 14days and so calculating a useless high "time left" value. The algorithm in the graph view is much slower, because every single data-point must be read and calculated, but for the prediction it ignores all charging times, so in the example above it would calculate the time left based on 91% discharge over 14 days.
If you in a battery consuming activity and want to know how long the battery would last in this activity, the glance and details view calculation should be just fine. Also, if your watch recharges during the day by solar, and you assume similar solar input for the future, the glance and details view will give you a good idea about how long the battery will last.
For the case that you have recharged your watch with the cable, or you don't expect much solar input for the future (or your watch does not have solar in the first place) the prediction in the graph view will give you a better idea for a long-term prediction, but it will take longer to get the results.
In both cases the prediction is rather pessimistic, so it will always floor decimal results (an estimation of 5.9h will show 5h)
Setting the Battery Charge Threshold to a value higher than 0 will cause the watch to send a notification to the connected phone when reaching that value during charging.
The check happens every 15min, so you might want to set the threshold to a relatively low value, because depending on your watch and the charger the charging time might be pretty short, so it can easily happen that by the time the check happens the battery is already charged much higher value.
The notification is actually a hack! There is no easy way to send a notification to the phone without creating a whole companion app. The hack is to request the phone to open a website. When the set threshold is reached the phone will display a notification saying that Garmin IQ wants to open the website http://battery-level-reached.garmin.
On an Android phone you can use Tasker together with AutoNotification to intercept the notification and to display something more sensible. Import this tasker profile & task for that.
This feature might change in the future, depending on the feedback.
The battery data, that was collected over time, can be exported to a WebDAV compatible cloud-storage (e.g. OwnCloud or Nextcloud)
- Open the settings of the widget in the Connect IQ app
- Enter the full URL of the place you want the file be written to. E.g.
https://<server>/remote.php/webdav/garmin.jsonfor OwnCloud.- The URL must start with
https://, and must be using a valid certificate. - If a file already exists at the destination, it will be overwritten without confirmation
- The URL must start with
- If your server requires authentication, enter the username and password.
- In the graph view press the "GPS" button to start the export.
- If the transfer succeeded, a "Done!" message is displayed.
- The exported file will contain the data of the current graph in JSON format (this is a bit of technical format, but Garmin is limiting what can be sent from the watch.)To further work with the data you can convert it into the Excel format using this tool: https://www.convertcsv.com/json-to-csv.htm
- If the transfer failed an error code is displayed.
- negative codes come from Garmin, here a list with their meanings: https://developer.garmin.com/connect-iq/api-docs/Toybox/Communications.html
- positive codes are HTTP error codes, here a list with the meanings: https://developer.mozilla.org/en-US/docs/Web/HTTP/Status
- run in the Background: needed to check the battery status every 15min
- Send/receive information to/from the Internet: needed to send the notification to the phone and for the export function.
- Garmin Instinct 2 Series
- Garmin Fenix 6 Series
- Garmin Fenix 7 Series
- Garmin Forerunner 955 Series
- Garmin Descent G1 Series
If you think that tool would be also useful on your device please open an issue or contact me on twitter
- only calculates battery change till the last recorded data point not till now (this data can be already nearly 15min old)
see: https://github.com/individual-it/BatteryGuesstimate/issues
feel free to open issue if you have more ideas or contact me on twitter
