- Northwind_small.sqlite: Raw Data
- Project_Northwind_db.ipynb: Notebook for Analysis
- Presentation.pdf
We need to perform soem hypothesis tests on the Northwind Database. This is a Microsoft open sorce/free database.
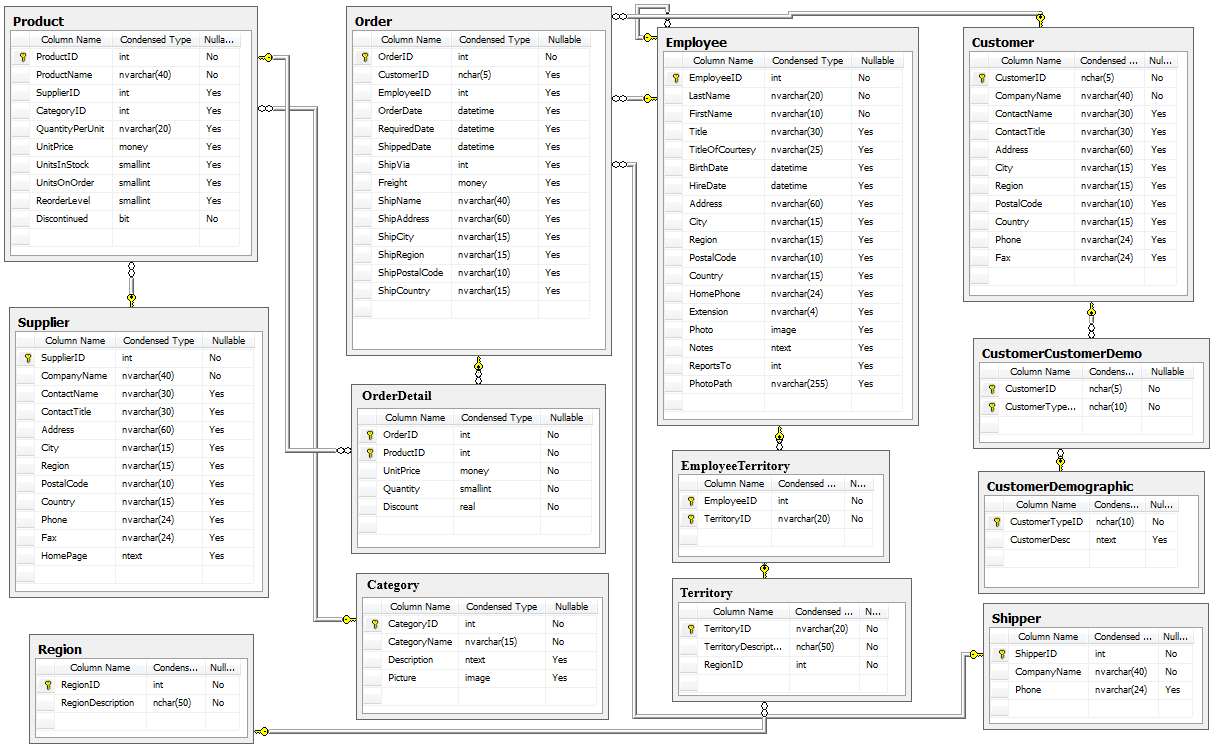
Our goal is to formulate hypothesis tests such that we can get some valuable insights for a potential company.
My approach for this project has been:
- Formulate interesting questions-->In order to get some useful insights
- EDA--> In order to get an understanding of our data summarizing their main characteristics mainly through visualization
- Defining Null and Alternative Hypotheses-->Answer to the research question and guide data collection and interpretation
- Set Alpha level--> I used a alpha level of 0.05 for all my Hypotheses
- Test our Data Set--> Use different tests to understand the p-value
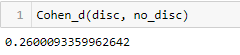
- Check Effect Size--> d cohen's formula
- Obtain valuable Insights--> Give some raccomandations
-
Does discount amount have a statistically significant effect on the quantity of a product in an order? If so, at what level(s) of discount?
-
Is it December, considering the Christmas time period in it, the month with the highest revenue?
-
Does discount amount have a statistically significant effect on the revenue of a product in an order? If so, at what level(s) of discount?
-
There is a statistically significant difference on shipping time between different shipper companies?
-
There is a statistically significant difference in terms of Revenue for different countries?
-
There is statistically significant difference in terms of Revenue between different categories?
Let's go through each question!
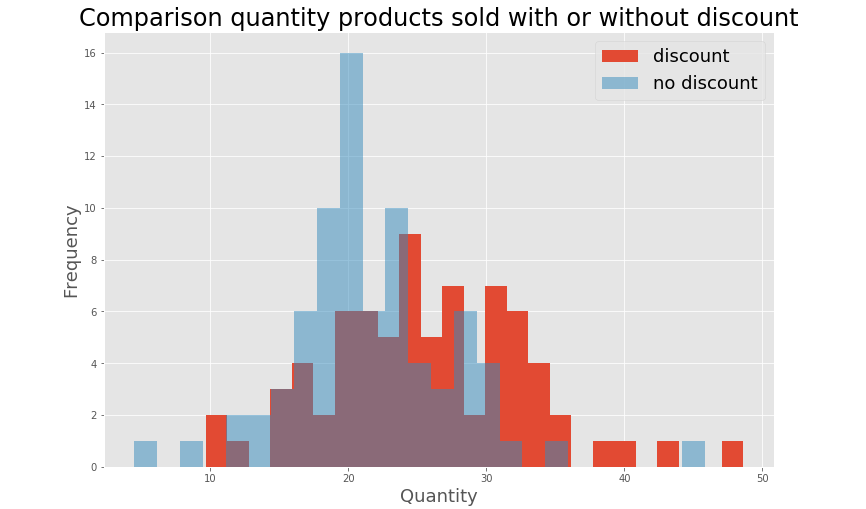
1. Does discount amount have a statistically significant effect on the quantity of a product in an order? If so, at what level(s) of discount?
Considering that we wanna observe if the quantity sold discounted is greater than the quantity sold not discounted we'll perform a One Tail Test.
H_null = qt. discounted sold <= qt. not discounted sold H_alt = qt. discounted sold > qt. not discounted sold
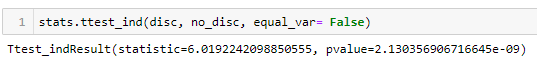
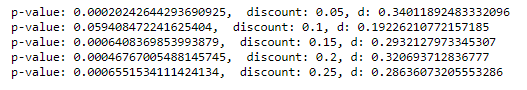
Results are all statistically significant except for the level 0.1.
This means that a discount of 10% on average doesn't have any impact on the quantity sold compared to not applying the discount.
We advice so, to use a 5% discount instead, d Cohen's for 5% discount results being the one with the highest effect size, moreover smaller leave us more profit but still does have an higher impact on quantity sold compared to the 10%, or to apply an higher discount level to try to increase the quantity sold.
Results, as we can see from the p-value, are all not statistically significant.
This means that we failed to reject the null hypothesis.
We advice the management build their strategies taking in consideration the presence or not of the discount instead of a comparison between different levels of discount.
H_null = Revenue for December <= Revenue other month
H_alt = Revenue for December > Revenue other month
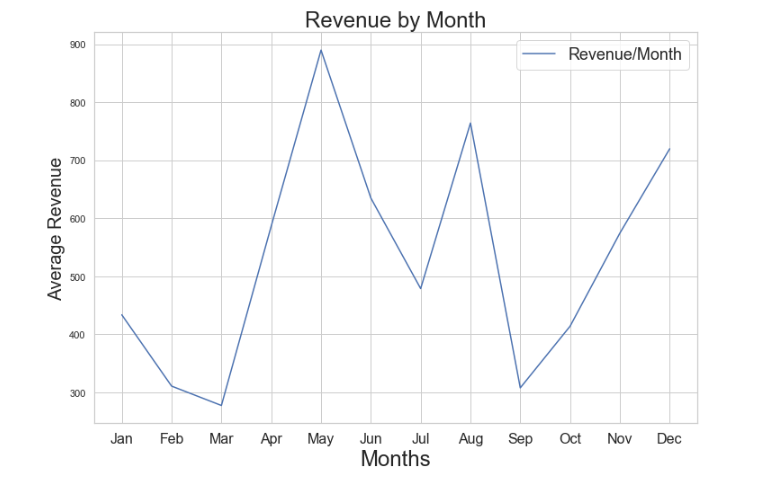
As we thought during December we've got an high Revenue peak due to the Christmas, but as we can see May results having the highest peak followed by August.
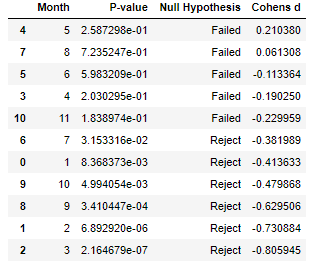
As we can see we failed to reject our hyphotheses for April, May, June, August and November.
This means that our Revenue is actually higher on these months compared to December.
Our advice is to focus our product strategies during these months, May furthermore gives us the highest effect size.
In fact could probably be more difficult trying to increase the overall Revenue during December, being the potential competition much higher and obstinate.
3. Does discount amount have a statistically significant effect on the revenue of a product in an order? If so, at what level(s) of discount?
H_null = Revenue with discount <= Revenue without discount
H_alt = Revenue with discount > Revenue without discount
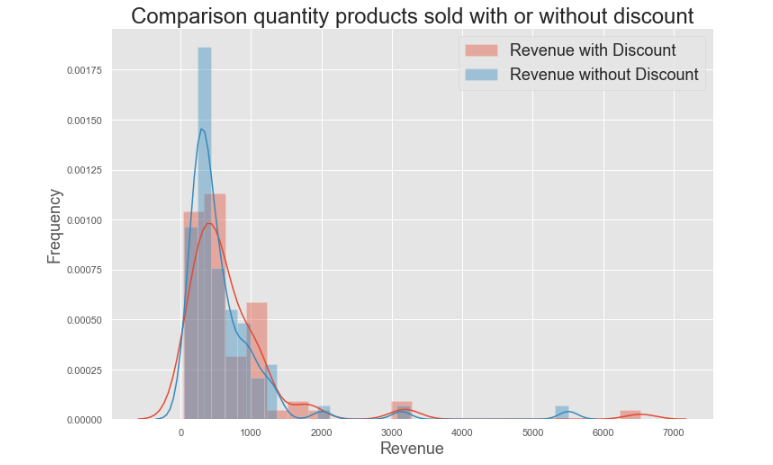
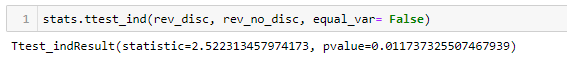

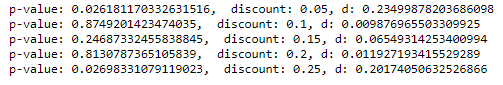
Results are not statistically significant for the levels 0.1, 0.15 and 0.2.
This means that a discount of 10%, 15% and 20% on average doesn't have any impact on the Revenue for the product sold compared to not applying the discount.
We advice so, to use a 5% discount instead, that being smaller leave us more profit but still does have an higher impact on Revenue, considering also the highest effect size, compared to the 10%, 15% an 20% or to apply a 25% discount level to try to increase the total Revenue.
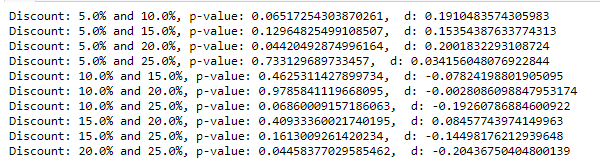
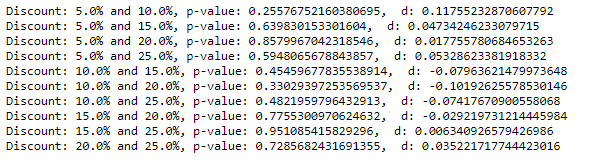
We reject our null hypothesis for 5% and 20% discounts and 20% and 25% discounts.
This means that there's statistical significant difference in terms of Revenue taking in consideration these 2 different levels of discount.
Our advice is to focus our attention on 5% and 20% , the d Cohen's effect size is significantly higher and the possibly strategies leave us with a higher profit being on comparison 25% discount higher than these 2.
4. There is a statistically significant difference on shipping time between different shipper companies?
H_null = there is no statistically difference beetwen different companies in terms of shipping time
H_alt = there is statistically difference beetwen different companies in terms of shipping time
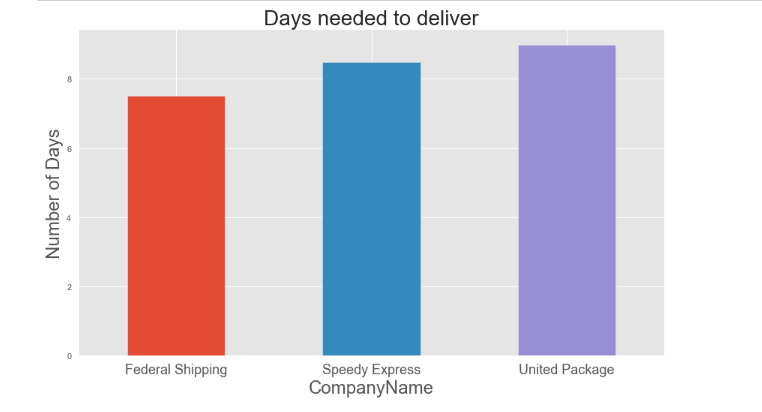
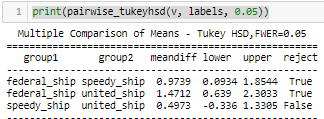
The test shows clearly that Federal Shipping is more efficient .
We advice the management to understand why the others companies are taking longer and in case to ask for a discount or to switch all the orders to the Federal shipper.
H_null = there is no statistically significant difference beetwen Europe and North-America in terms of Revenue
H_alt = there is statistically significant difference beetwen Europe and North-America in terms of Revenue

We reject the Null Hypothesis for all Groups compared, in terms of Revenue.
The Profit is the same in proportion no matter which Group we take in consideration.
H_null = there is no statistically difference beetwen different categories in terms of Revenue
H_alt = there is statistically difference beetwen different categories in terms of Revenue
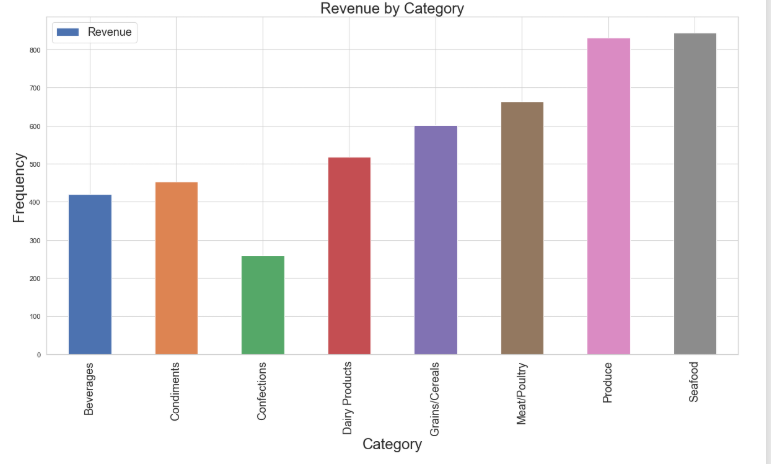
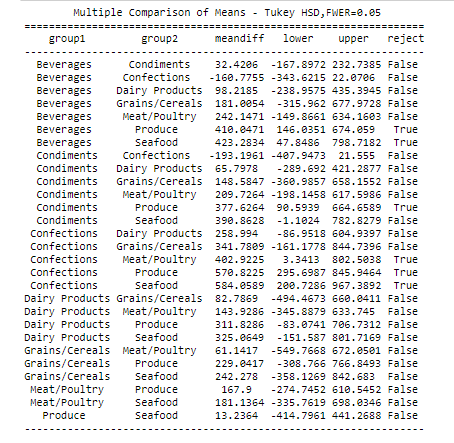
From our test results that there's a significant difference between categories.
Comes out that the categories with the highest Revenue are Seafood, Produce and Meat/Poultry.
In particular we raccomand to focus our production on Produce.
Being the description of this category "Dried fruit and bean curd" we know that are easy to conserve and ship compared to Seafood and Meat/Poultry.