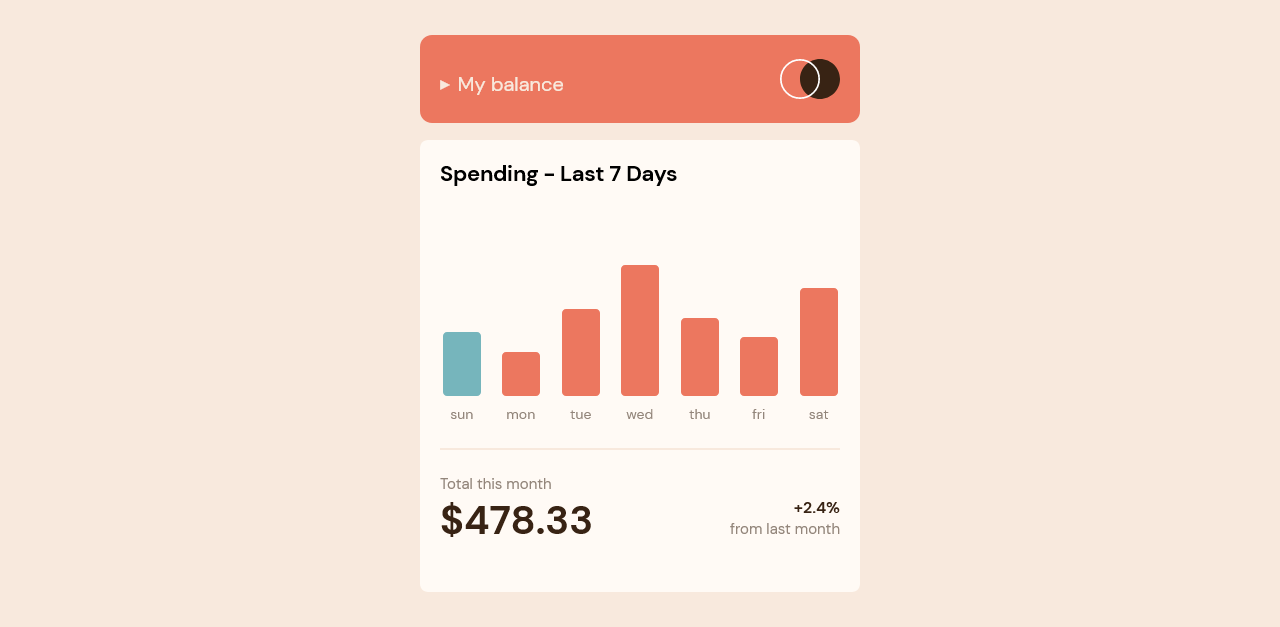
This is a solution to the Expenses chart component challenge on Frontend Mentor. Frontend Mentor challenges help you improve your coding skills by building realistic projects.
Users should be able to:
- View the bar chart and hover over the individual bars to see the correct amounts for each day
- See the current day’s bar highlighted in a different colour to the other bars
- View the optimal layout for the content depending on their device’s screen size
- See hover states for all interactive elements on the page
- Bonus: Use the JSON data file provided to dynamically size the bars on the chart
- Semantic HTML5 markup
- CSS custom properties
- Flexbox
- CSS Grid
- Mobile-first workflow
An element with position: fixed; is positioned relative to the viewport, it always stays in the same place even if the page is scrolled, unlike absolute which is relative to its closest assestor with positio relative.
.loader {
    position: fixed;
}Ill focus on creating more animations. Thanks to @caroline for the awesome animation.
Ill like to say thanks to everyone thats been helping me, to all my mentors and new friends. Happy New Year 😍
