This version of the package is now deprecated! The new version of the AJIVE code can be found under https://github.com/idc9/mvdr
author: Iain Carmichael
Additional documentation, examples and code revisions are coming soon. For questions, issues or feature requests please reach out to Iain: iain@unc.edu.
jive is a data analysis package for high-dimensional, multi-block (or multi-view) data. The multi-block data setting means two or more data matrices with a fixed set of observations (e.g. patients) and multiple sets of features (e.g. clinical features and gene expression data).
The primary algorithm in this package is Angle based Joint and Individual Variation Explained (AJIVE) which is a data integration/feature extraction algorithm. AJIVE finds joint modes of variation which are common to all K data blocks as well as modes of individual variation which are specific to each block. For a detailed discussion of AJIVE see Angle-Based Joint and Individual Variation Explained. An R version of AJIVE can be found here.
To install use pip:
pip install jiveOr clone the repo:
git clone https://github.com/idc9/py_jive.git
python setup.py install
jive is currently available for python 3
from jive.AJIVE import AJIVE
from jive.PCA import PCA
from jive.ajive_fig2 import generate_data_ajive_fig2
from jive.viz.block_visualization import data_block_heatmaps, jive_full_estimate_heatmaps
import matplotlib.pyplot as plt
# %matplotlib inline

X, Y = generate_data_ajive_fig2()
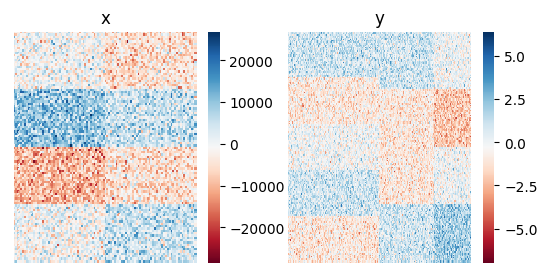
data_block_heatmaps([X, Y])
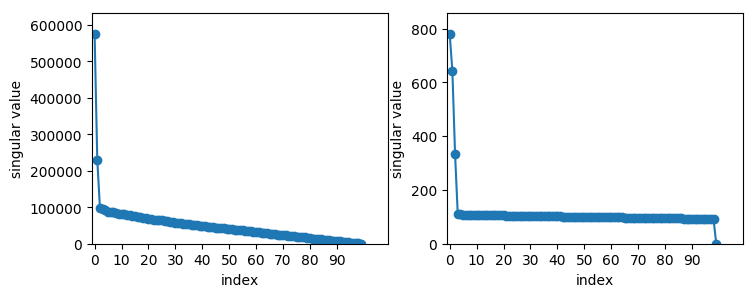
# determine initial signal ranks by inspecting scree plots
plt.figure(figsize=[10, 5])
plt.subplot(1, 2, 1)
PCA().fit(X).plot_scree()
plt.subplot(1, 2, 2)
PCA().fit(Y).plot_scree()ajive = AJIVE(init_signal_ranks={'x': 2, 'y': 3})
ajive.fit(blocks={'x': X, 'y': Y})
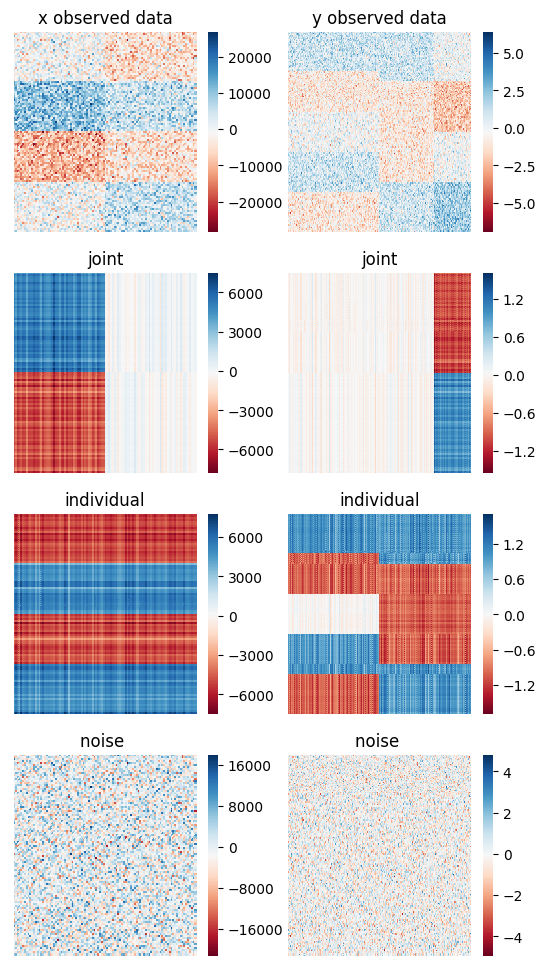
plt.figure(figsize=[10, 20])
jive_full_estimate_heatmaps(ajive.get_full_block_estimates(),
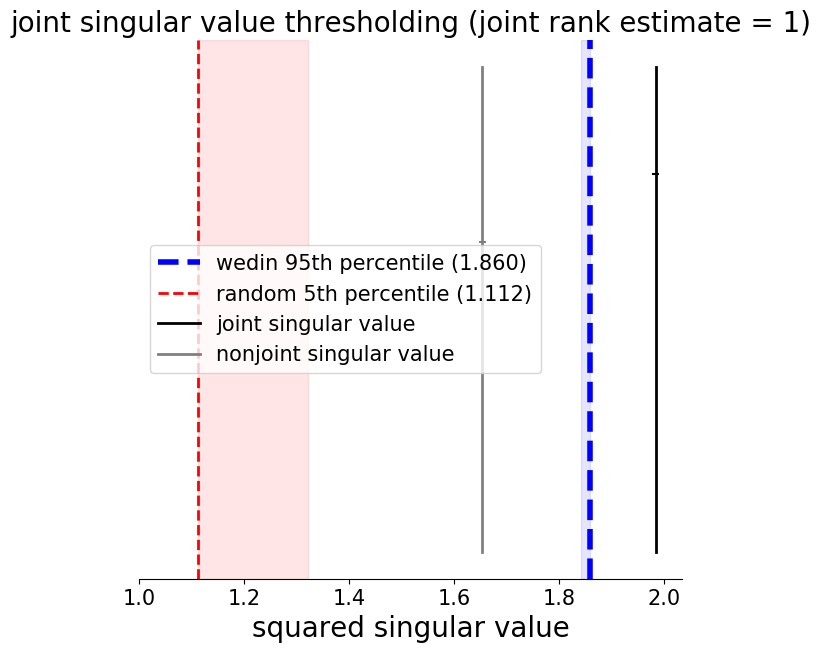
blocks={'x': X, 'y': Y})ajive.plot_joint_diagnostic()Additional documentation, examples and code revisions are coming soon. For questions, issues or feature requests please reach out to Iain: iain@unc.edu.
The source code is located on github: https://github.com/idc9/py\_jive. Currently the best math reference is the AJIVE paper.
Testing is done using nose.
We welcome contributions to make this a stronger package: data examples, bug fixes, spelling errors, new features, etc.


