2019-04-25 Support for Valgrind 3.15.0, x86_linux, amd64_linux, arm_linux
2018-10-17 Support for Valgrind 3.14.0, x86_linux, amd64_linux, arm_linux (Thanks @vanhauser-thc)
2017-08-10 Support for Valgrind 3.13.0, x86_linux and amd64_linux
2015-10-06 Support for Valgrind 3.11.0, x86_linux and amd64_linux
2014-09-15 Support for Valgrind 3.10.0, x86_linux and amd64_linux
2013-11-18 Currently supporting: Valgrind 3.9.0, x86_linux and amd64_linux
Make sure you have Docker installed. Then do:
~$ git clone http://github.com/wmkhoo/taintgrind
~$ cd taintgrind
~/taintgrind$ docker build -t taintgrind .
After the container is built, you can run taintgrind by doing
~/taintgrind$ sudo docker run -it --rm -v $(pwd):/pwd taintgrind <ARGUMENTS>
~/taintgrind$ sudo docker run -it --rm -v $(pwd):/pwd taintgrind tests/sign32
-
Download Valgrind
~$ tar jxvf valgrind-X.X.X.tar.bz2 ~$ cd valgrind-X.X.X ~/valgrind-X.X.X$ -
Git clone taintgrind
~/valgrind-X.X.X$ git clone http://github.com/wmkhoo/taintgrind.git ~/valgrind-X.X.X$ cd taintgrind -
Run build_taintgrind.sh (to build valgrind, taintgrind and Capstone)
The script does the following:
	# Patch valgrind-3.13
	patch -d ../ -p0 < d3basics.patch

	# Build valgrind
	cd ../ && \
	    ./autogen.sh && \
	    ./configure --prefix=`pwd`/build && \
	    make && \
	    make install

	# build capstone
	cd taintgrind && \
	    wget https://github.com/aquynh/capstone/archive/3.0.4.tar.gz -O capstone.tar.gz && \
	    tar xf capstone.tar.gz && \
	    sh configure_capstone.sh `pwd`/../build && \
	    cd capstone-3.0.4 && \
	    sh make_capstone.sh

	# build taintgrind
	cd ../ && \
	    ../autogen.sh && \
	    ./configure --prefix=`pwd`/../build && \
	    make && \
	    make install && \
	    make check
A simple example is tests/sign32.c
1  #include "taintgrind.h"
2  int get_sign(int x) {
3      if (x == 0) return 0;
4      if (x < 0)  return -1;
5      return 1;
6  }
7  int main(int argc, char **argv)
8  {
9      int a = 1000;
10     // Defines int a as tainted
11     TNT_TAINT(&a, sizeof(a));
12     int s = get_sign(a);
13     return s;
14 }
The TNT_TAINT client request (defined in taintgrind.h) taints a.
Compile with
../taintgrind$ make check
Run with
../taintgrind$ ../build/bin/valgrind --tool=taintgrind tests/sign32
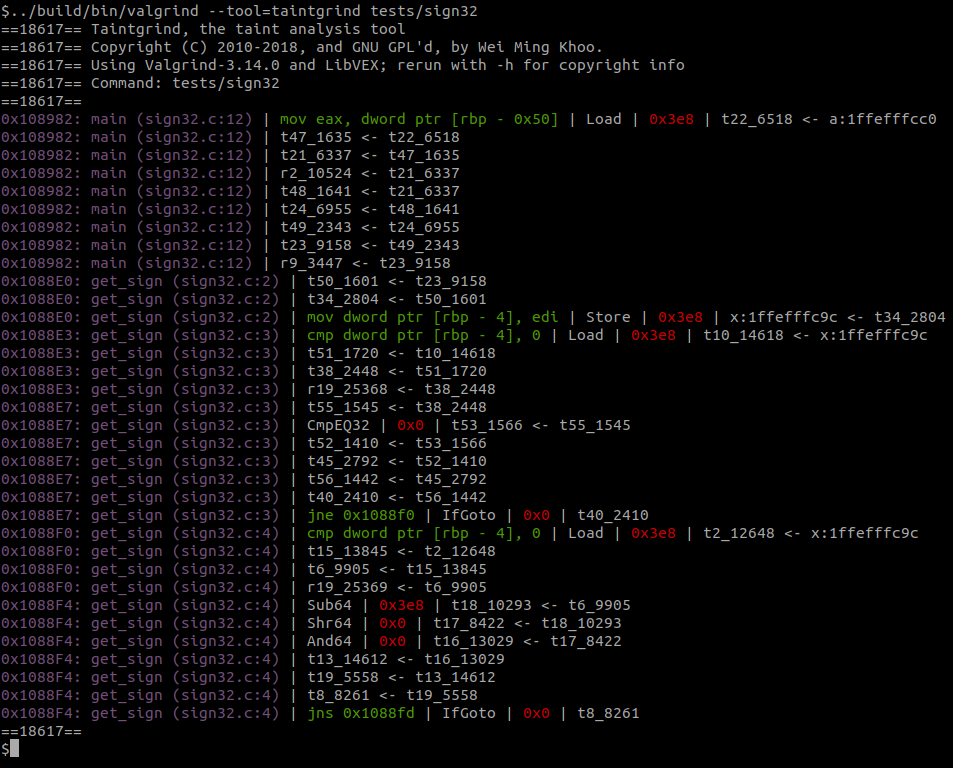
The output of taintgrind is of the form
Address/Location | Assembly instruction | Instruction type | Runtime value(s) | Information flow
The first instruction indicates an integer is loaded from a into temporary variable t22_6518. Its run-time value is 0x3e8 or 1,000 (hightlighted in red). With debugging information, taintgrind can list the source location, e.g. sign32.c:12 (highlighted in magenta), and the variable name (a). Only one run-time/taint value per instruction is shown. That variable is usually the one being assigned. In the case of an if-goto, it is the conditional variable; in the case of an indirect jump, it is the jump target; for loads and stores, it is the data. The assembly instructions, e.g. jne 0x1088f0, are highlighted in green. The other instructions are intermediate VEX instructions, which have been either omitted or simplified. As expected, the conditions (instructions 0x1088E7 and 0x1088F4, are both false, and are thus 0.
See Detecting a classic buffer overflow
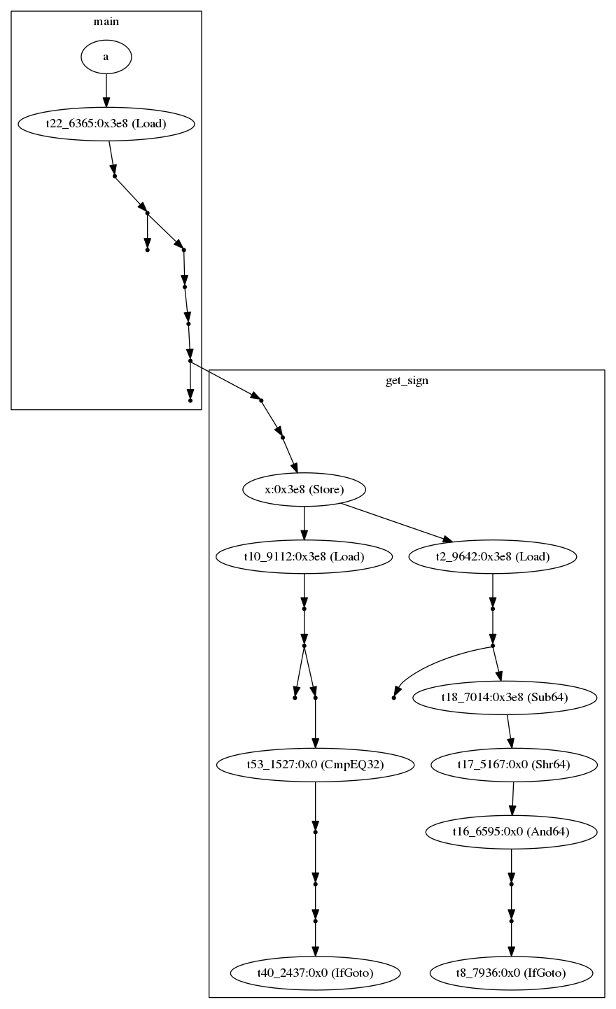
Create a Graphviz dot file with e.g.
$ valgrind --tool=taintgrind tests/sign32 2>&1 | python log2dot.py > sign32.dot
Visualise the graph with
$ sudo apt install graphviz
$ dot -Tpng sign32.dot -o sign32.png
Or, for larger graphs
$ dot -Tsvg sign32.dot -o sign32.svg
~/valgrind-X.X.X/taintgrind$ ../build/bin/valgrind --tool=taintgrind --help
...
user options for Taintgrind:
    --file-filter=<full_path>   full path of file to taint [""]
    --taint-start=[0,800000]    starting byte to taint (in hex) [0]
    --taint-len=[0,800000]      number of bytes to taint from taint-start (in hex)[800000]
    --taint-all= no|yes         taint all bytes of all files read. warning: slow! [no]
    --tainted-ins-only= no|yes  print tainted instructions only [yes]
    --critical-ins-only= no|yes print critical instructions only [no]
If the file-filter field is '*', it is equivalent to --taint-all=yes. Tainted instructions are really instructions where one or more of its input/output variables are tainted. At the moment, critical instructions include loads, stores, conditional jumps and indirect jumps/calls. If --critical-ins-only is turned on, all other instructions are not printed. The last two options control the output of taintgrind. If both of these options are 'no', then taintgrind prints every instruction executed. Run without any parameters, taintgrind will not taint anything and the program output should be printed.
Run Taintgrind with e.g.
$ valgrind --tool=taintgrind --file-filter=/path/to/test.txt --taint-start=0 --taint-len=1 gzip path/to/test.txt
See Generating SMT Libv2 output
Reverse taint analysis tracks data from sink to the source. After a crash, use rtaint on the Taintgrind log file to track data back to the input file.
Taintgrind is based on Valgrind's MemCheck and Flayer.
Taintgrind borrows the bit-precise shadow memory from MemCheck and only propagates explicit data flow. This means that Taintgrind will not propagate taint in control structures such as if-else, for-loops and while-loops. Taintgrind will also not propagate taint in dereferenced tainted pointers.
Taintgrind has been used in SOAAP and Secretgrind.
Taintgrind is licensed under GNU GPLv2.

