RMarkdown script to pull and analyze user activity data from any DHIS2 Tracker program
DHIS2 does not have user-level analytics. Instead, DHIS2 analytics is restricted to a period dimension, an organization unit dimension, and a data dimension (such as a data element or program indicator). Analytics therefore assumes that one user is active per organization unit. However, there are often multiple users often working at a single organization unit, such as at a health clinic, making it difficult to know which users are entering data and when. Luckily, DHIS2 keeps a log of every entry of a data element into a tracker program at the /trackedentitydatavalueaudit API endpoint, including username and timestamp, enabling analysis of tracker activity at the user level through various API calls.
How to Run this analysis
- Download R Studio: https://rstudio.com/products/rstudio/download/
- Download the entire dhis2-user-analysis repository. It includes the folder structure to output user plots.
- Open the R studio project, then open the .Rmd file.
- Enter DHIS2 instance URL and your username details where specified, plus the parameters for your analysis.
- Execute the script with knitr See this example of executing Rmarkdown with knitr
- Necessary packages will be downloaded if they are not already on your system, and you will be prompted to enter this DHIS2 user password, which is encrypted.
- Analysis for each USER GROUP and each USER is outputted to the working directory as separate PNG files. Thus, execution of the script may take some time, depending on the size of your DHIS2 instance.
- When executing Knitr, the resulting output is an HTML summary of the analyses performed.
- You can save and share the html file itself, or host it on your own server. All interactivity is client-side, so a Shiny app is not required. But be sure to keep the plots within the same folder as the HTML file, for dynamic viewing of usergroup and user files.
If you are unfamiliar with RMarkdown and knitr, do check out the online tutorial.
Analysis routines included in the script:
- Total users with accounts, users who logged in, users who entered tracker data
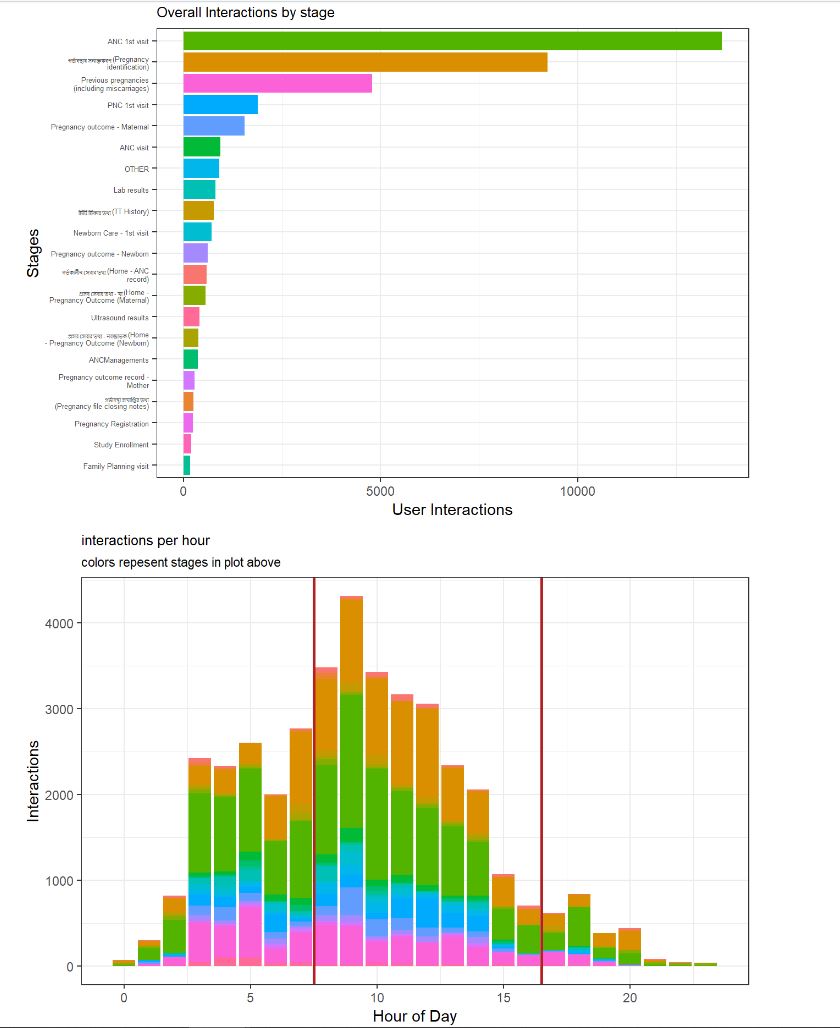
- Top stages by level of user interactions
- Analysis of user interactions, aggregated for each user group, by stage and hour
- Analysis of user interactions for each indivdual user, by stage and by hour
- Percent of interactions within "work hours" for user groups and users
- Day of week and time of day charts
- Session duration (time between first and last change user made on stage)
- Events where more than one user edited the record
In addition, the knitr document has optional parameters:
- If params: fake_displayNames is set to true, the user's full displayNames are anonymized, and overwritten with Star Wars characters. This may make it easier to share sensitive user data with external partners.
- Parameters can be set for skipping generation of charts for user groups and individual users, respectively. This can speed up the analysis time.
This script has been tested on two large DHIS2 production systems. More input, suggestions, and extensions are encouraged!
Example graphics below. Sample HTML output is included in the repo.