![]()

Collect your UniFi controller data and report it to an InfluxDB instance, or export it for Prometheus collection. Prometheus support is new, and much of the documentation still needs to be updated; 12/2/2019. Ten Grafana Dashboards included; with screenshots. Five for InfluxDB and five for Prometheus.
See the Wiki! We have a special place for Docker Users. I'm willing to help if you have troubles. Open an Issue and we'll figure out how to get things working for you. You can also get help in the #unifi-poller channel on the Ubiquiti Discord server. I've also provided a forum post you may use to get additional help.
Ubiquiti makes networking devices like switches, gateways (routers) and wireless access points. They have a line of equipment named UniFi that uses a controller to keep stats and simplify network device configuration. This controller can be installed on Windows, macOS and Linux. Ubiquiti also provides a dedicated hardware device called a CloudKey that runs the controller software. More recently they've developed the Dream Machine; it's still in beta / early access, but UniFi Poller can collect its data!
UniFi Poller is a small Golang application that runs on Windows, macOS, Linux or Docker. In Influx-mode it polls a UniFi controller every 30 seconds for measurements and exports the data to an Influx database. In Prometheus mode the poller opens a web port and accepts Prometheus polling. It converts the UniFi Controller API data into Prometheus exports on the fly.
This application requires your controller to be running all the time. If you run a UniFi controller, there's no excuse not to install Influx or Prometheus, Grafana and this app. You'll have a plethora of data at your fingertips and the ability to craft custom graphs to slice the data any way you choose. Good luck!
I found a simple piece of code on GitHub that sorta did what I needed; we all know that story. I wanted more data, so I added more data collection. I believe I've completely rewritten every piece of original code, except the copyright/license file and that's fine with me. I probably wouldn't have made it this far if Garrett hadn't written the original code I started with. Many props my man.
The original code pulled only the client data. This app now pulls data for clients, access points, security gateways, dream machines and switches. I used to own two UAP-AC-PROs, one USG-3 and one US-24-250W, but have since upgraded a few devices. Many other users have also provided feedback to improve this app, and we have reports of it working on nearly every switch, AP and gateway.
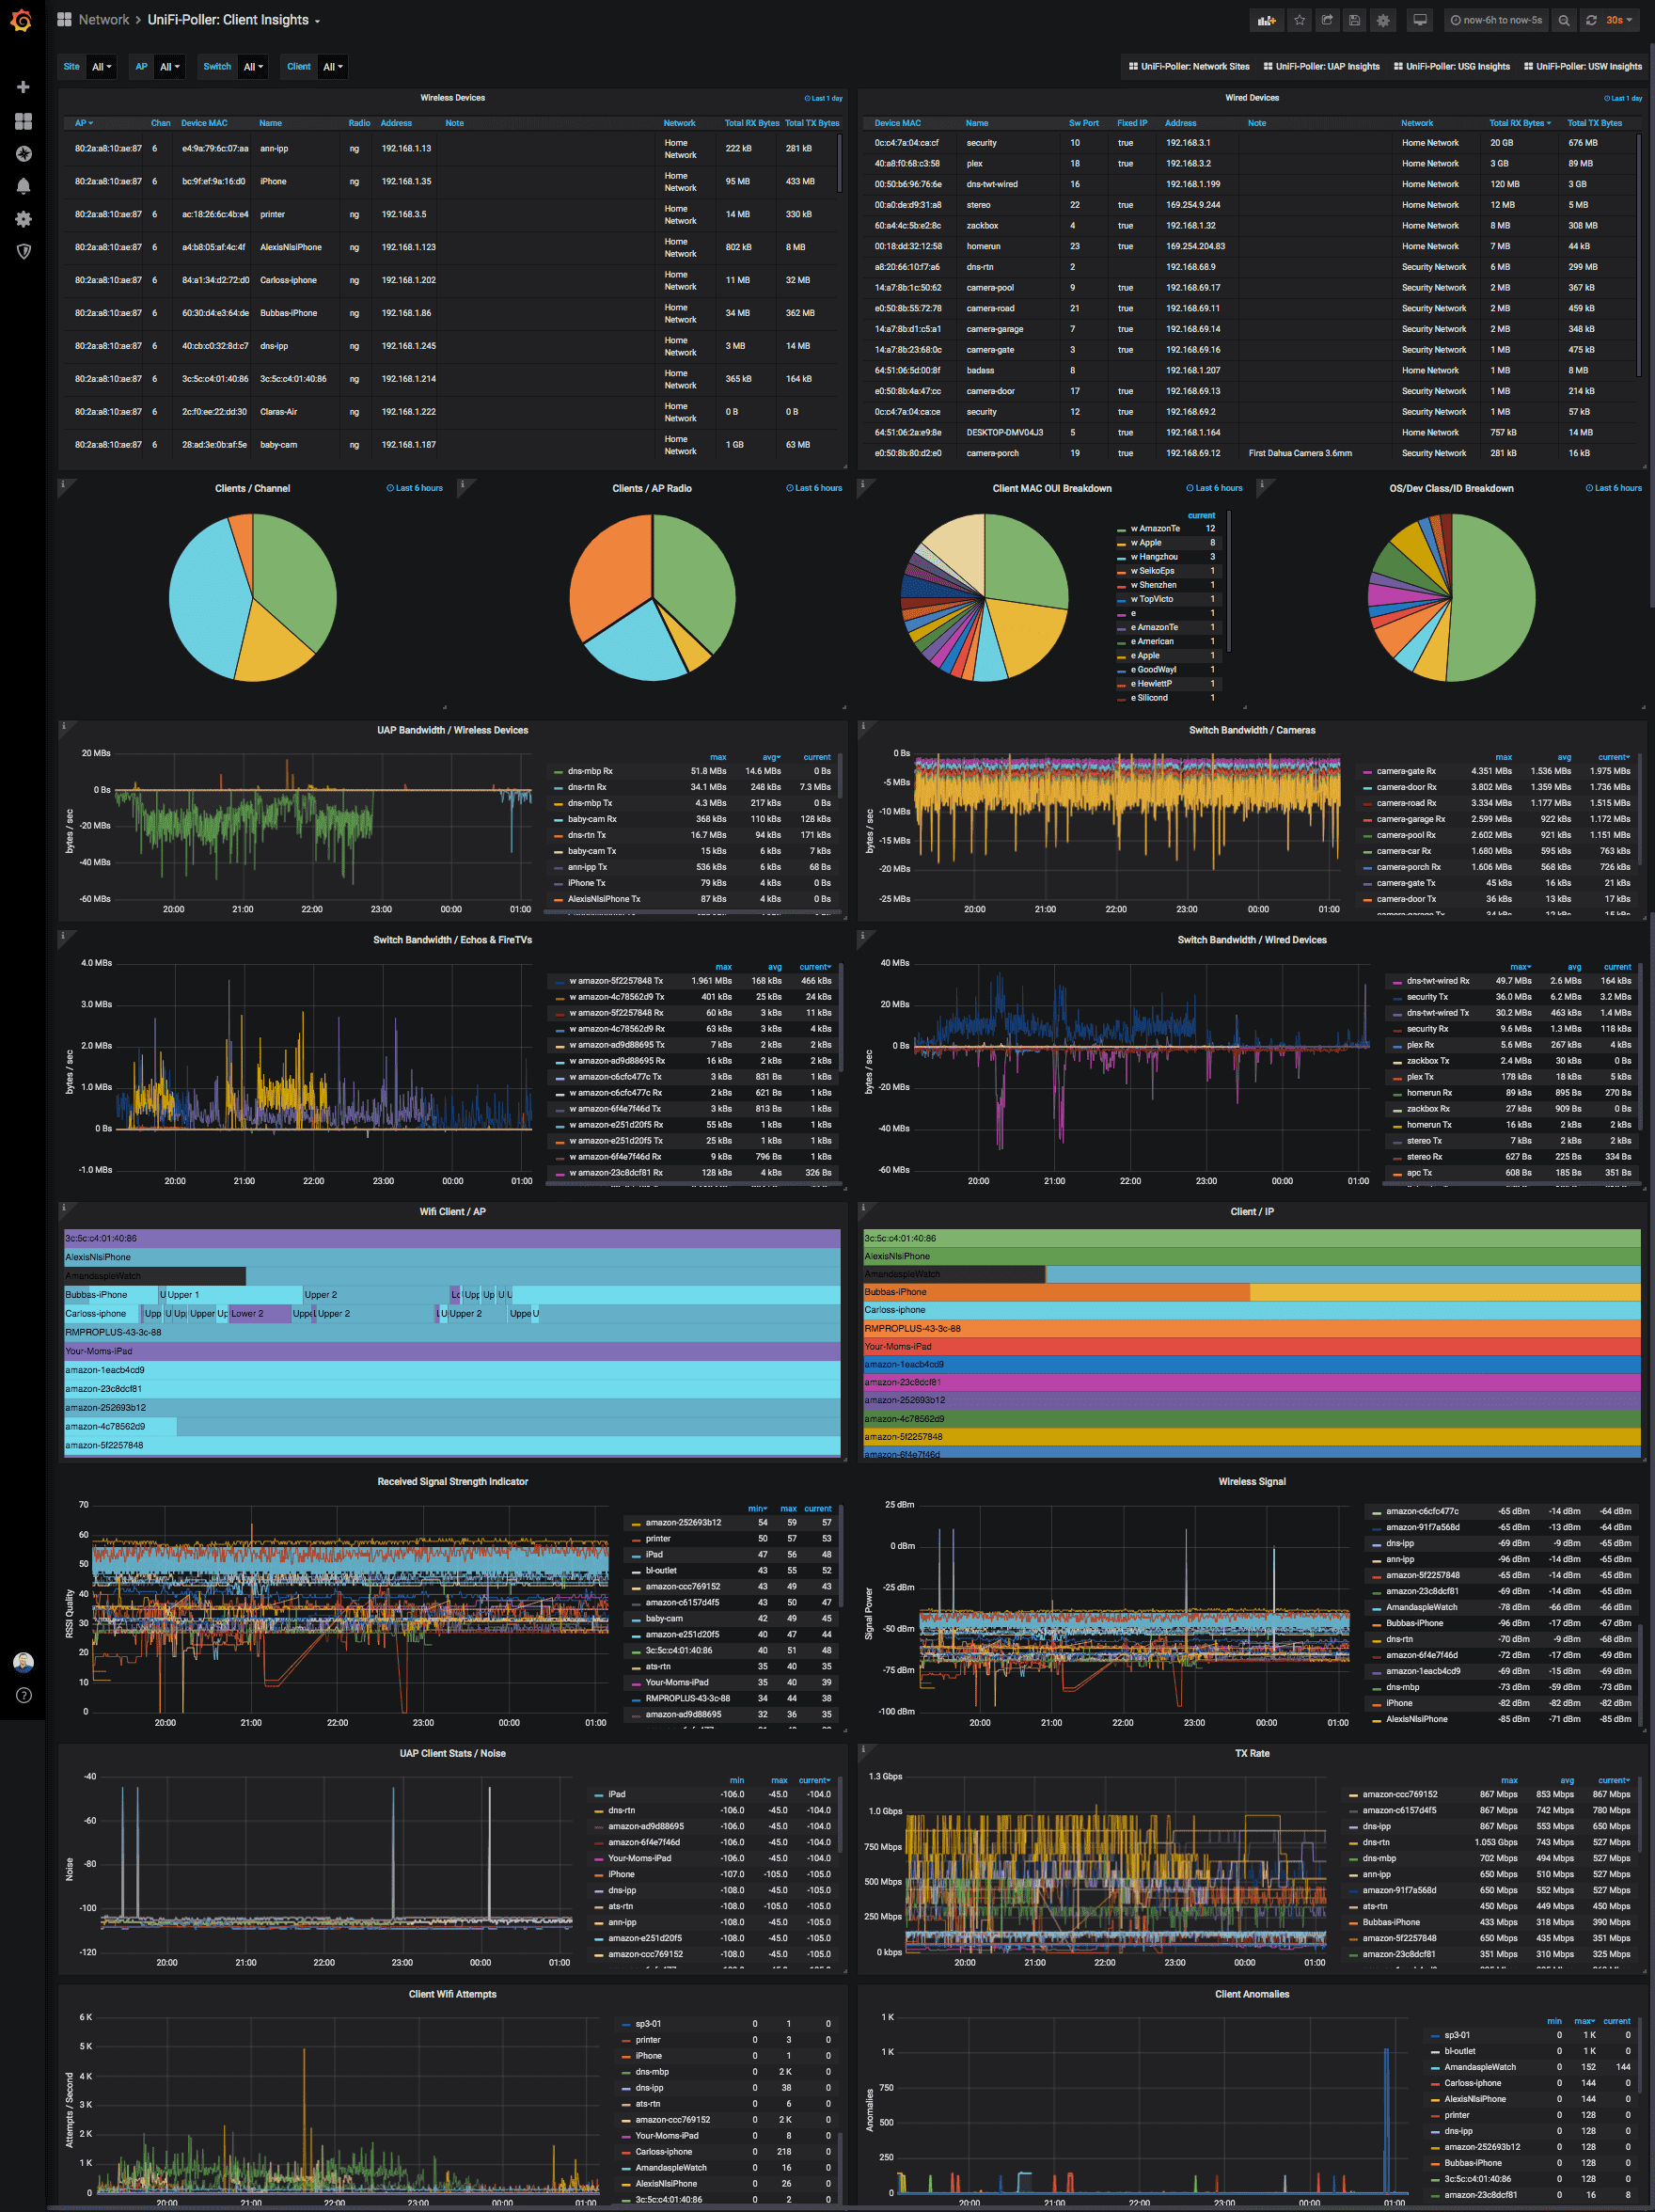
I've been trying to get my UAP data into Grafana. Sure, google search that. You'll find this. What if you don't want to deal with SNMP? Well, here you go. I've replicated 400% of what you see on those SNMP-powered dashboards with this Go app running on the same mac as my UniFi controller. All without enabling SNMP nor trying to understand those OIDs. Mad props to waterside for making this dashboard; it gave me a fantastic start to making my own dashboards.
You can control this app with puppet, chef, saltstack, homebrew or a simple bash script if you needed to. Packages are available for macOS, Linux and Docker. It comes with a systemd service unit that allows you automatically start it up on most Linux hosts. It works just fine on Windows too. Most people prefer Docker, and this app is right at home in that environment.
The UniFi data extraction is provided as an external library, and you can import that code directly without futzing with this application. That means, if you wanted to do something like make telegraf collect your data instead of UniFi Poller you can achieve that with a little bit of Go code. You could write a small app that acts as a telegraf input plugin using the unifi library to grab the data from your controller. As a bonus, all of the code in UniFi Poller is in libraries and can be used in other projects.
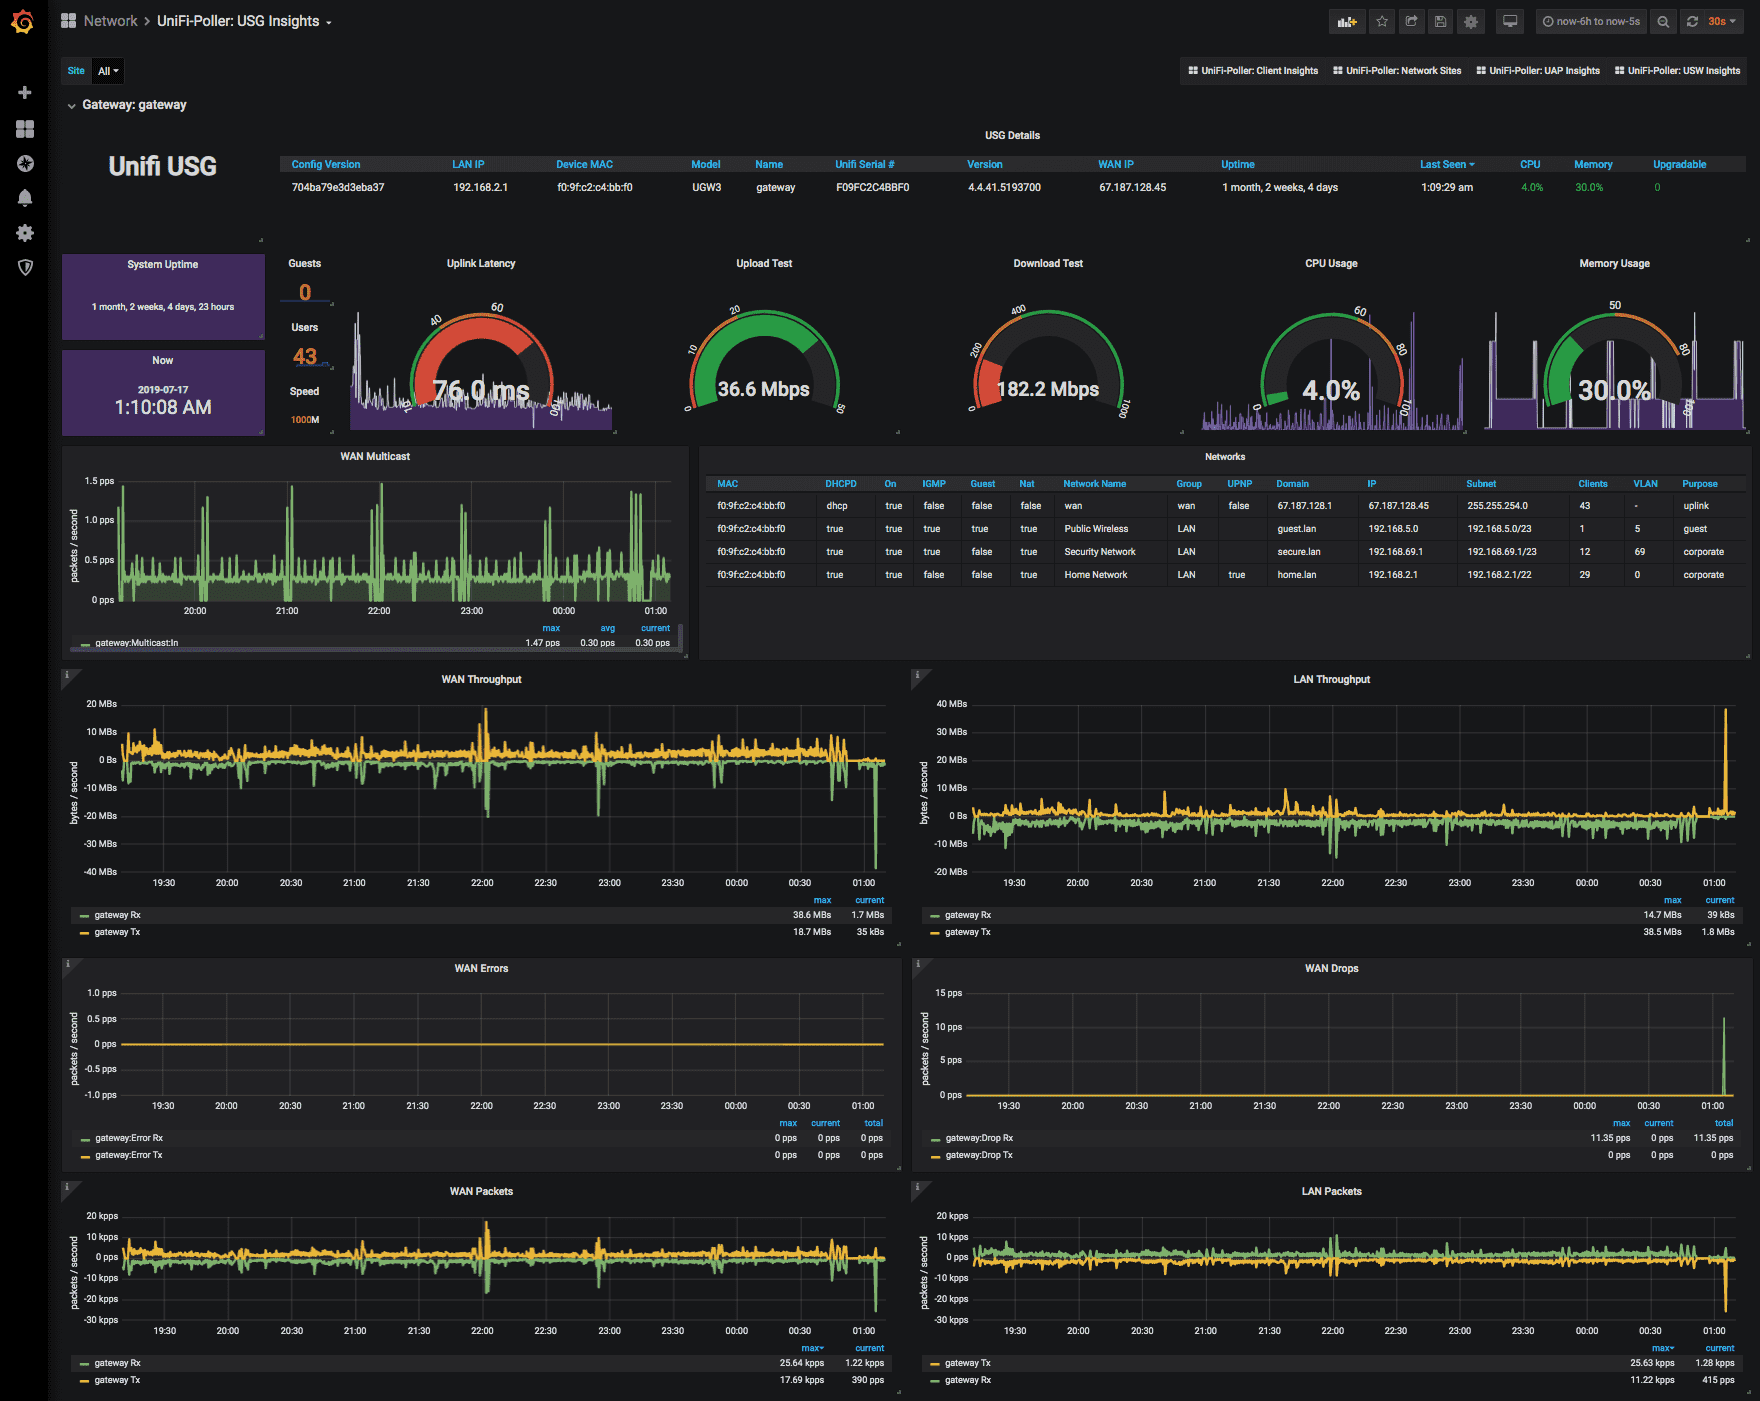
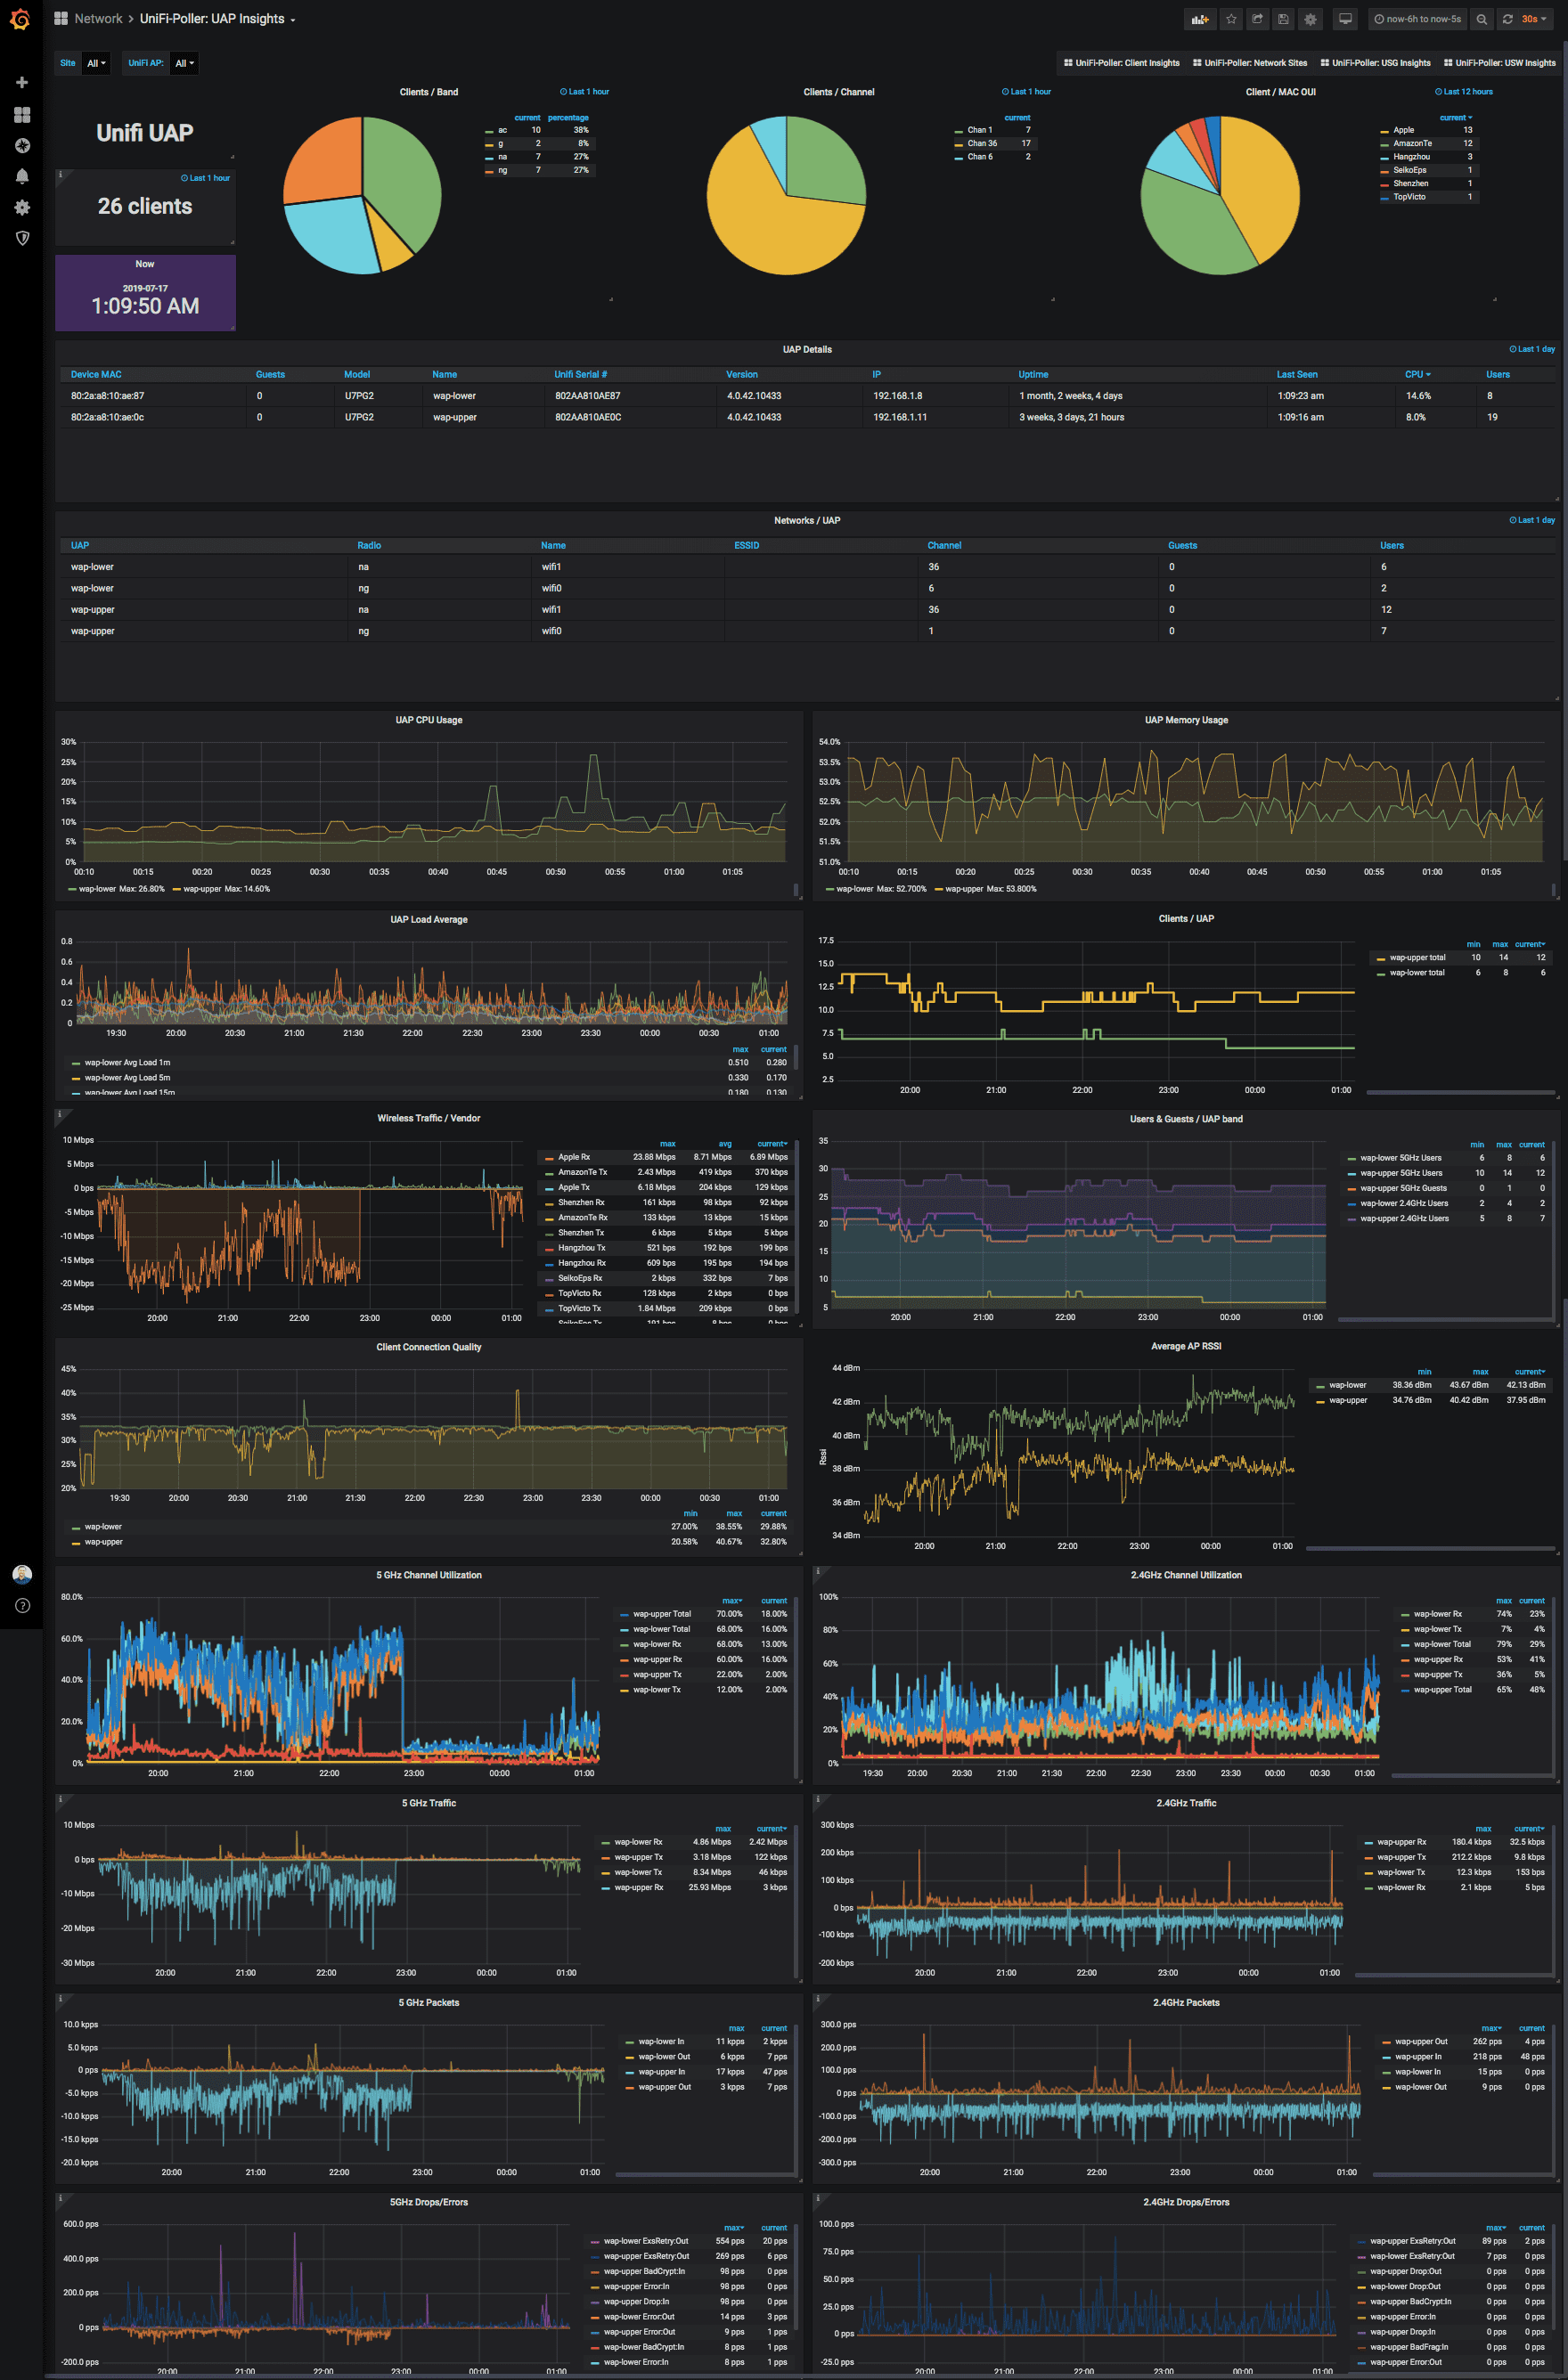
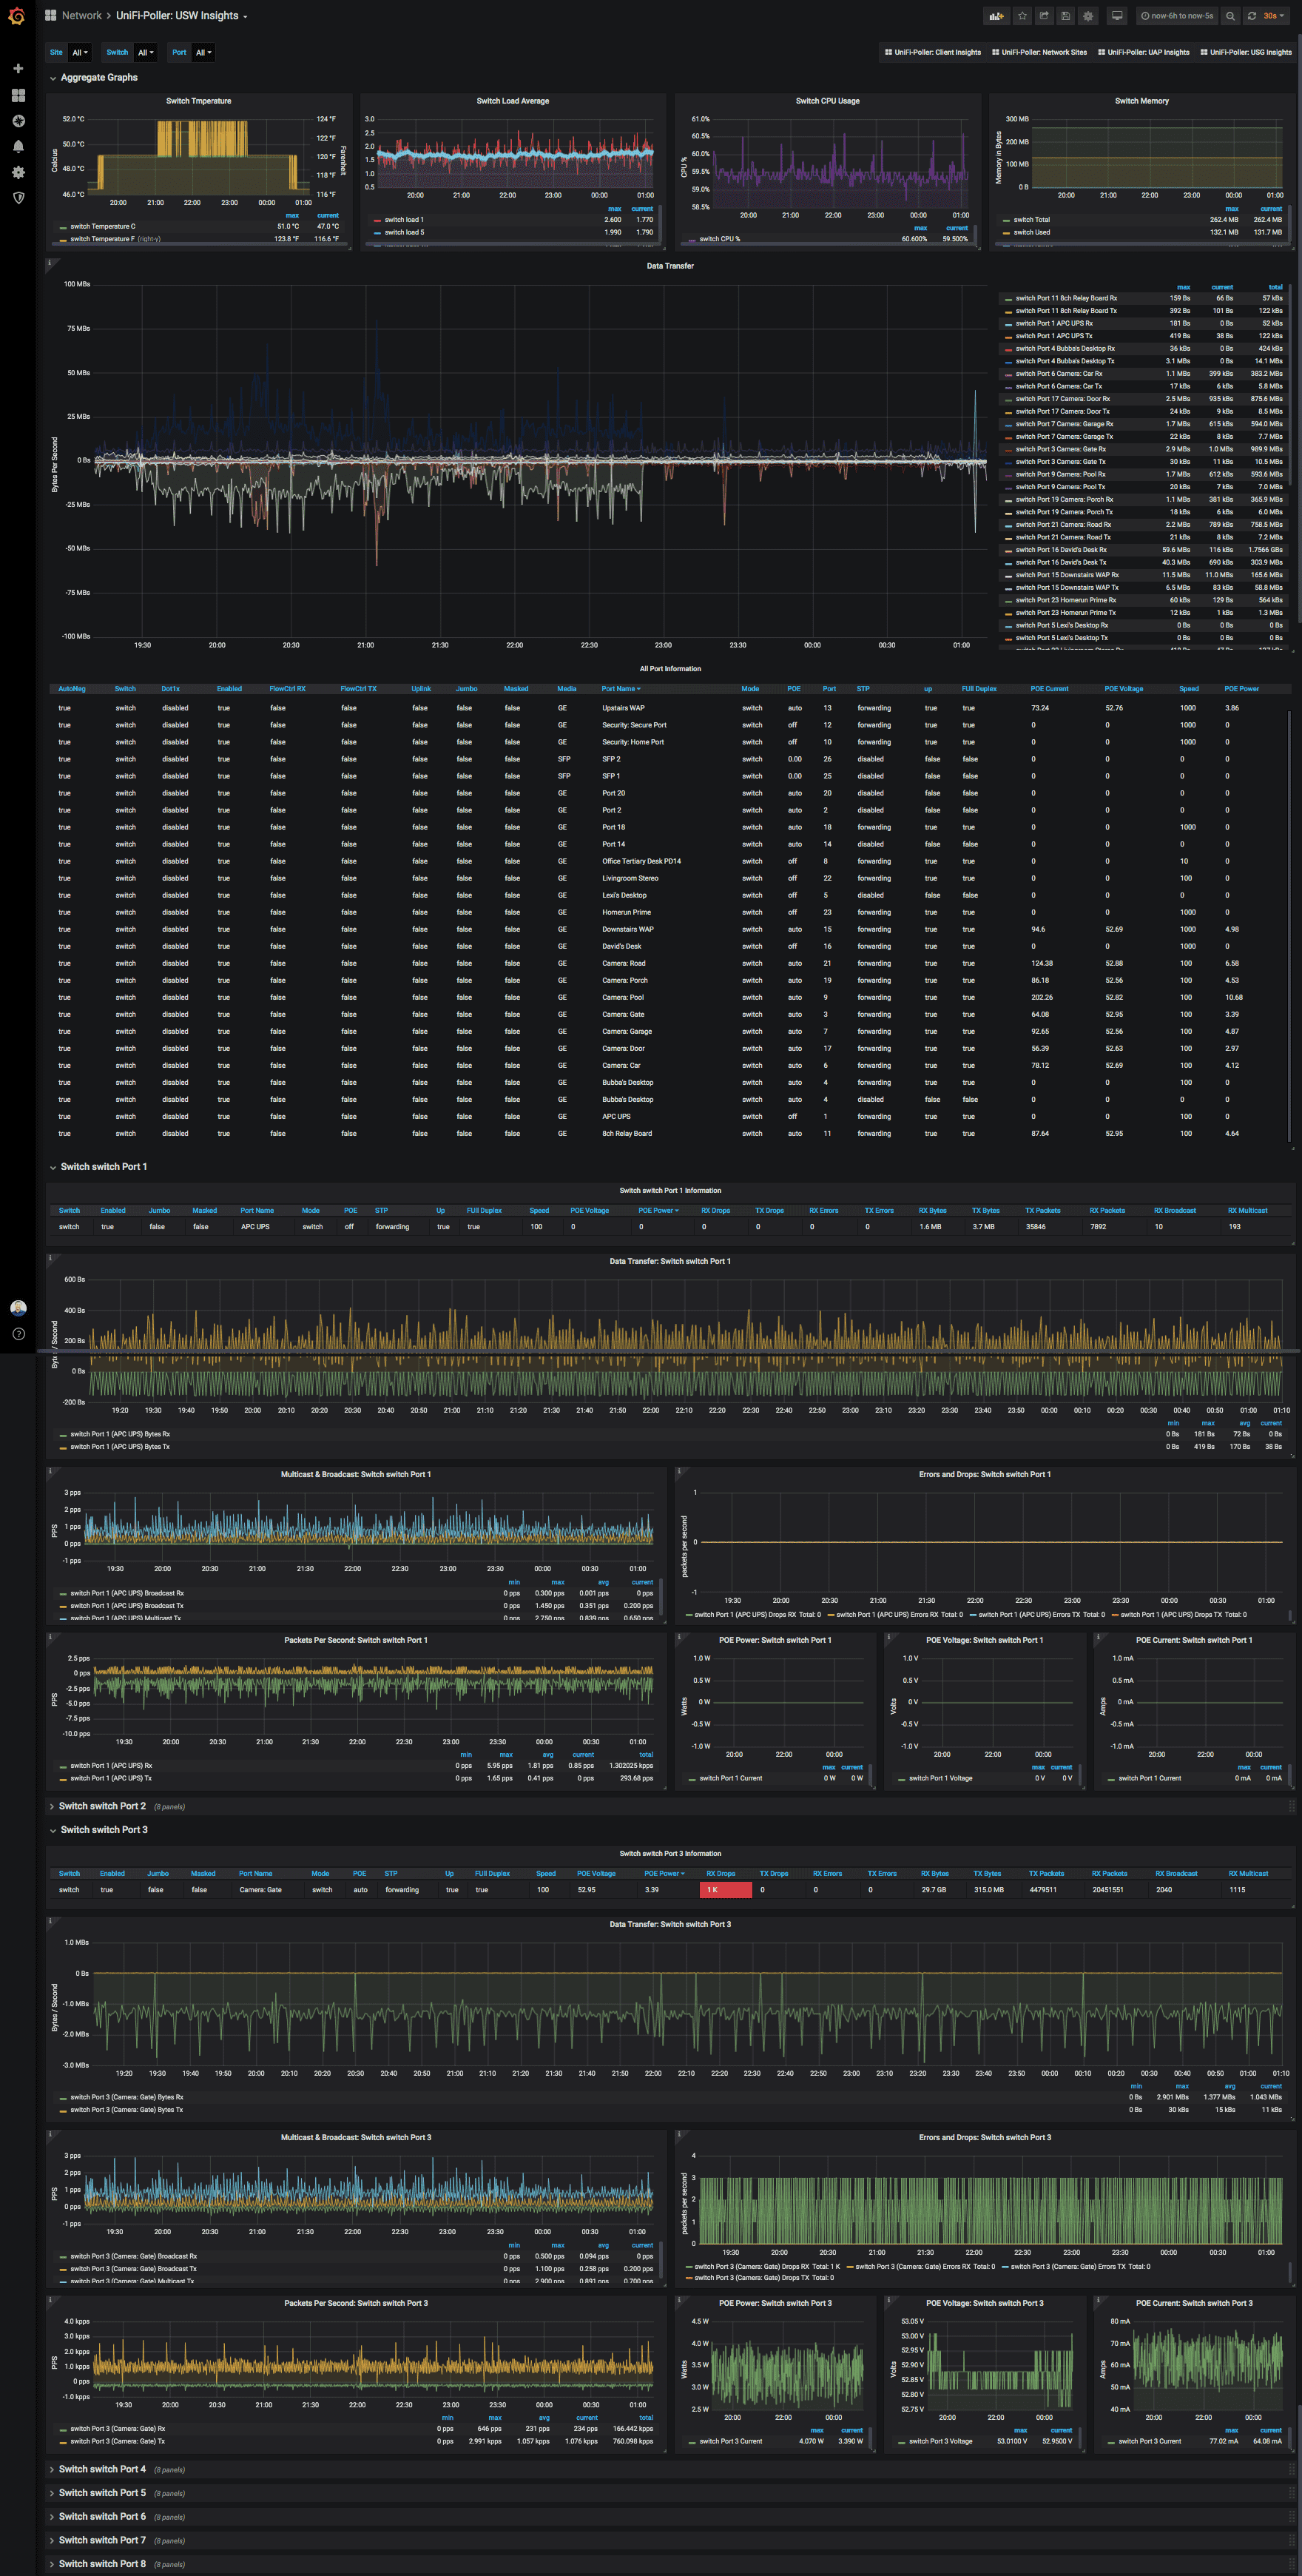
There are five total dashboards available. Below you'll find screenshots of a few.
You can drill down into specific sites, switches, and ports. Compare ports in different
sites side-by-side. So easy! This screenshot barely does it justice.
The following fine folks are providing their services, completely free! These service integrations are used for things like storage, building, compiling, distribution and documentation support. This project succeeds because of them. Thank you!


![]()
- Copyright © 2018-2020 David Newhall II.
- See LICENSE for license information.