Basic implementation of simple kriging predictions and stochastic simulations using Numpy,
along with methods for cross-validation and visualization.
Civil & Environmental Engineering 263n: Scalable Spatial Analytics at UC-Berkeley, Fall 2016
By Paul Sohn, October 26, 2016
This Python module includes a basic implementation of a geostatistical predictive model (simple kriging, equivalent to Gaussian process regression) and methods for stochastic simulation and visualization. The model is tested using rainfall measurements from 827 locations; 414 observations are used as training data and the other 413 observations are used as test data.
The SimpleKriging class provides methods for prediction and simulation, explored below:
The SimpleKriging class is instantiated with a training dataset. Predictions for a test dataset
are made according to:
where
where
train = np.genfromtxt('data/train_data.csv', delimiter=',',skip_header=True)
test_raw = np.genfromtxt('data/test_data.csv', delimiter=',',skip_header=True)
test = test_raw[:,1:]
We then instantiate a model using the SimpleKriging class and predict values
using the SimpleKriging.predict method, with some arbitrary values:
kriging = gaussian.SimpleKriging(training_data=train)
predict = kriging.predict(test_data=test, l=.5, sigma=.2)
predict[:5]

array([[ 70.94340417],
       [ 23.70437824],
       [ 49.57131344],
       [ 71.06713418],
       [ 70.69029366]])
How can we find better values for l and sigma? We can use the cross_validation function
to experimentally find values that minimize cross-validation error.
l_to_test = np.arange(0.7, 1.3, 0.05)[1:]
sigma_to_test = np.arange(0.16, 0.2, 0.005)[1:]

l_opt, sigma_opt, func, rmse_low = gaussian.cross_validate(train,
                                                     l_values=l_to_test,
                                                     sigma_values=sigma_to_test,
                                                     rmse_opt=1000,
                                                     k_folds=5)
We get values of l_opt = 1.05 and sigma_opt = 0.195, and we can substitute these in
to the prediction above. This is what I used for my Kaggle submission.
We can generate stochastic simulations using these predictive values by adding a
Cholesky decomposition to the predictive means and adding them to a self-defined grid.
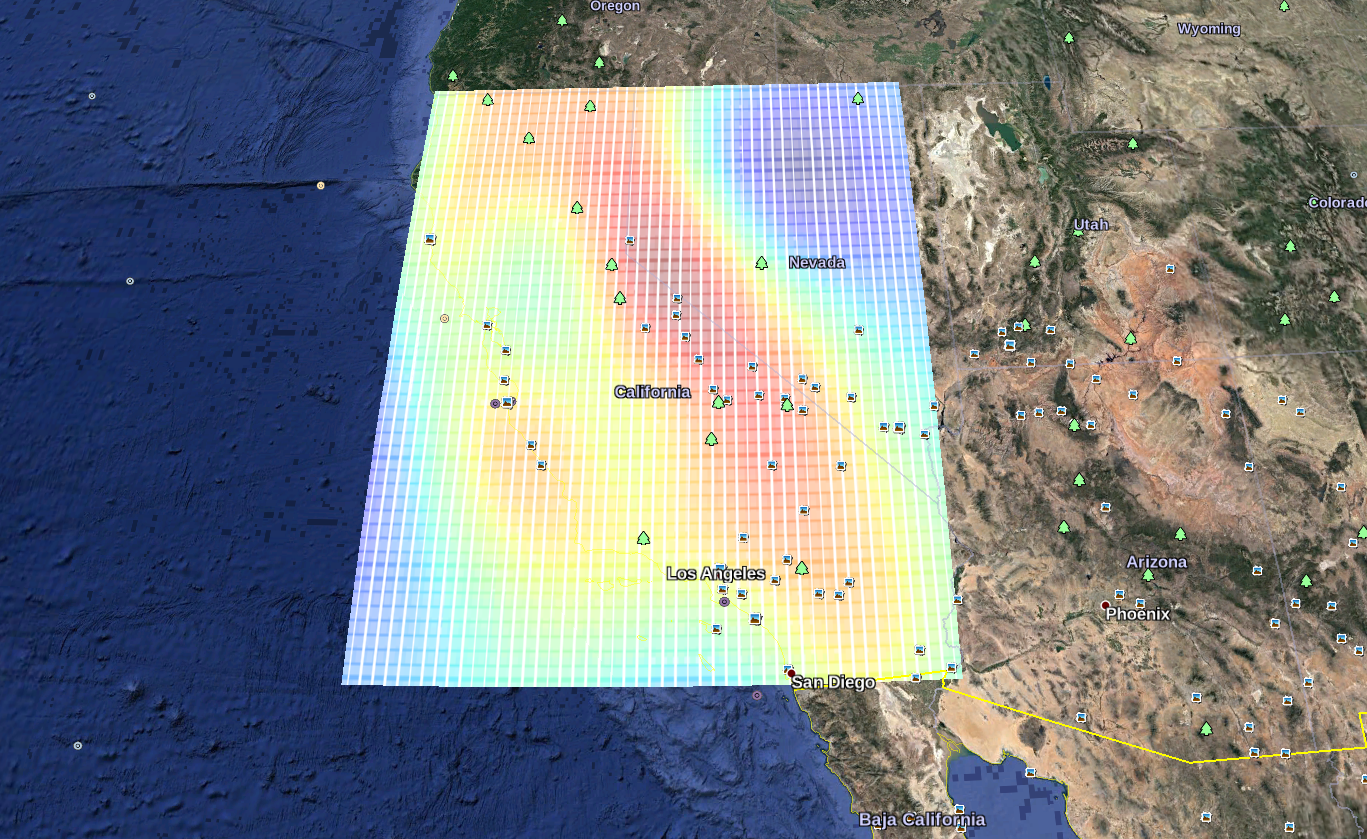
The SimpleKriging.simulate method includes the ability to output an image and a .kml file
in order to visualize predictions in Google Earth:
