Welcome to the repository for CSC 343 Homework 3!
This README will guide you through setting up the project and getting the graph visualization running in your local browser. Make sure to read the instructions here thoroughly from start to end before writing any code.
-
Creating a new branch and Cloning the Repository:
- First, you will need to create a new branch in your GitHub repository to hold your work.
- Create a branch through the GitHub interface.
- Name your
<branch>asyourlastname_yourfirstname_dev(very important , do NOT name it anything else) - Clone this repository to your local machine with a command similar to:
-
where
git clone -b <branch> https://github.com/CSC343-HCI-F23/csc343-f23-hw3-<your-username>.git
<your-username>is your GitHub username.
-
Install dependencies:
Assuming you installed Node.js and npm correctly in Homework 1, navigate to the root of the cloned repository and run the following command to install the necessary Node.js dependencies.
cd csc343-f23-hw3-<your-username>
npm install
-
Copy the output graph data file from Homework 1 into the root of your cloned repository:
By graph data, we refer to
output_graph.jsonfile that you produced at the end of Homework 1, which should contain yournodes,edgesandnodeDegreeattributes. It is expected to have the following format:{ "nodes": [], "edges": [], "nodeDegrees": [] }
-
Read the Graph data:
A
GraphClass.jsfile is provided to which defines a minimal data structure for the graph data. You are to read the graph data fromoutput_graph.jsoninto this data structure. -
Render the Graph
Implement the main rendering functionality (and all associated functionality to support interactions with the visualization) in the file
index.jswhich imports theGraphClass. The starter function definitions forloadAndRenderGraph(),renderGraph(graphData)anddisplayGraphStatistics(graphObj)are the same as those which were given in Homework 2. You are expected to swap in yourindex.jsfile from Homework 2, and to modify/add new methods to support the visualization functionality required in Homework 3. -
Compute Graph Statistics:
GraphClass.jscontains some basic function definitions corresponding to problems (2) and (3). Implement these functions and render the computed statistics on the canvas of your graph visualization (hint: A possible approach here would be to call these functions inside thedisplayGraphStatistics(graphObj)method inindex.js). Of course, you should also add all of your previous statistics calculation methods from Homework 2 inGraphClass.jsand must still be able to render them on the canvas.Also, you should not edit these files:
./tests.js./server.js.github/workflows/run-tests-on-pull.yml
-
Test your code:
Tests have been provided for you in the
./tests.jsfile. To run all the provided tests, just type/runnpm testfrom command line from the root of the repository. These tests are to verify the correct implementation of problems (2) and (3).If your code passes the test cases, you will see output like:
  GraphClass

#computelargestConnectedComponent()
  ✔ should compute the correct number of nodes in largestConnectedComponent of the dummy graph

#computeGraphDiameter()
  ✔ should compute the correct graph diameter for the dummy graph

2 passing (2ms)
-
Study the provided HTML file:
Just like Homework 2, the project includes an HTML file
index.html, pre-configured with some starter metadata, elements and styles, to assist you in displaying your graph visualization. We provide some helpful div's withid's andclassnames that should be self-explanatory. You are expected to swap in yourindex.htmlfrom Homework 2, and to add any additional modifications needed to support the functionality of Homework 3. Feel free to re-structure, and restyle this HTML file (including changing div/class names) to suit your needs.index.htmlwill be the webpage on which your graph is rendered. -
Start the HTTP Server:
To view the interactive graph visualization, you'll need to serve the HTML file
index.html, through an HTTP server. Run the following command to start the server:node server.js
By default, the server runs on port 3000. We provide a pre-configured
server.jsfile for serving webpages. You should not modify it. -
View in Browser:
Open your web browser e.g. Chrome and navigate to: http://localhost:3000
You should now be able to see the interactive graph visualization.
As you are working on the code, you should regularly git commit to save your current changes locally and git push to push all saved changes to the remote repository on GitHub.
To submit your assignment, create a pull request on GitHub, where the "base" branch is "master" or "main", and the "compare" branch is the branch you created at the beginning of this assignment. Then, go to the "Files changed" tab and make sure that all your changes look as you would expect them to.
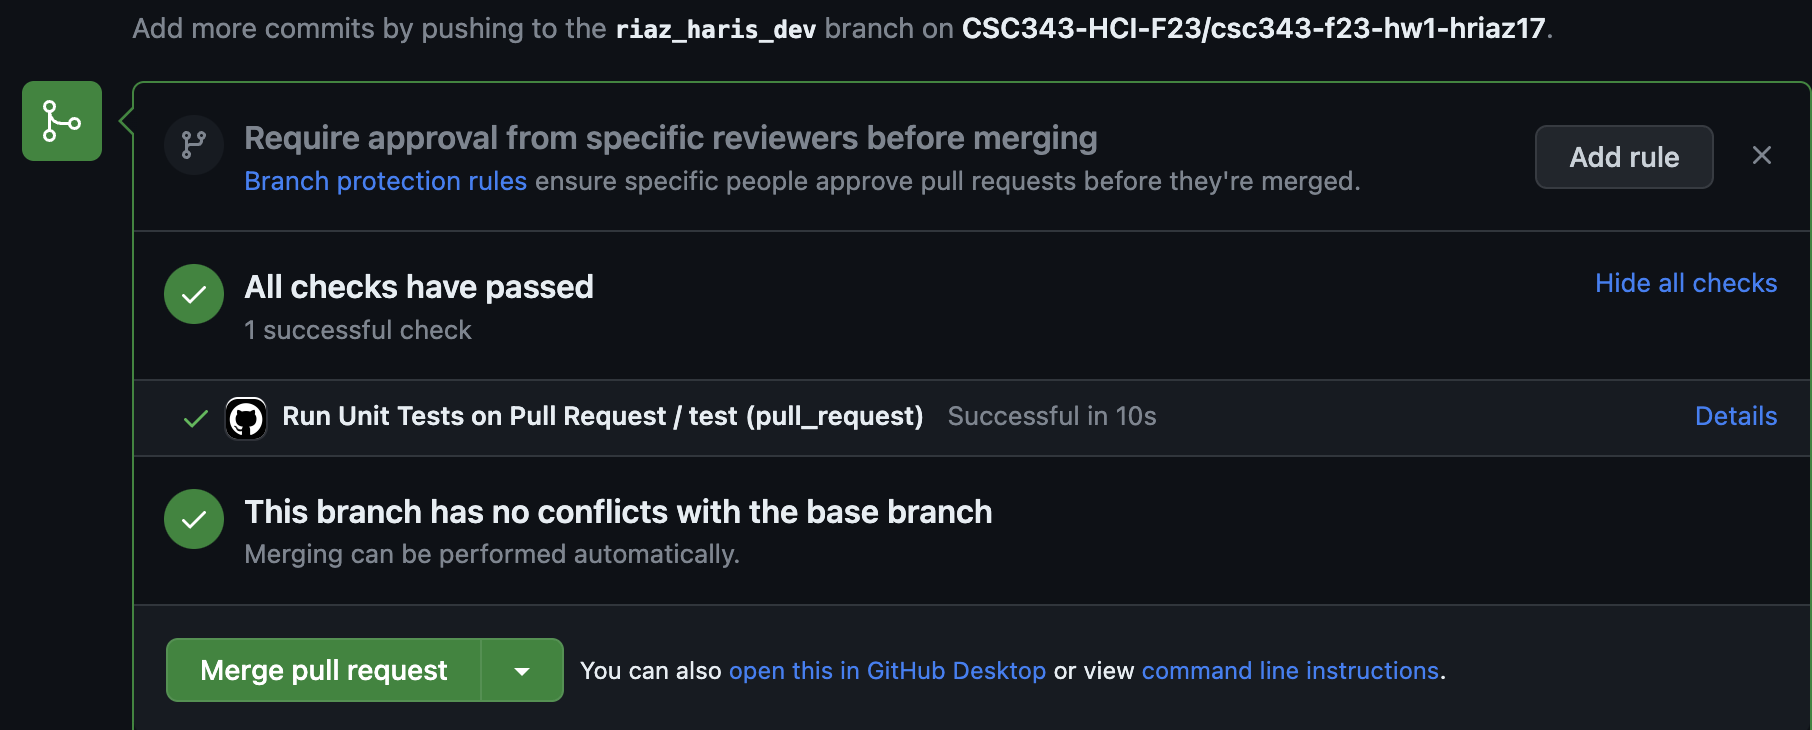
There are test cases that will be run automatically (via., Github Actions) when a pull request is submitted. These are the same as npm test.
So if your code passed npm test in your machine, it’s highly likely that it will pass in GitHub. Nevertheless, you should make sure that you see a green tick mark or a message saying “All Checks Have Passed” like this:
Once you create your pull requests, leave them open. Do NOT merge them into main/master and do NOT close them.
