-data
-shapefiles
/#Files needed to create a map of zipcodes
https://github.com/Jprebys/mod2-project-group-3/tree/master/data/shapefiles
-Zipcodes_for_King_County_and_Surrounding_Area___zipcode_area.cpg
- Zipcodes_for_King_County_and_Surrounding_Area___zipcode_area.dbf
-Zipcodes_for_King_County_and_Surrounding_Area___zipcode_area.prj
-Zipcodes_for_King_County_and_Surrounding_Area___zipcode_area.shp
-Zipcodes_for_King_County_and_Surrounding_Area___zipcode_area.shx
-Zipcodes_for_King_County_and_Surrounding_Area___zipcode_area.xml
-Sales.csv
/#A .csv containing data on sold homes in King county, WA
-master.csv
/#Merged .csv of Parcel.csv, Real_Property_Sales.csv, and Residential_Building.csv
-zipcodes.csv
/#Zipcodes of King County, WA
-notebooks
/#contains .pynb notebooks where code is written https://github.com/Jprebys/mod2-project-group-3/tree/master/notebooks -exploratory /#Contains exploratory notebooks https://github.com/Jprebys/mod2-project-group-3/tree/master/notebooks/exploratory -Adam_Exploratory.ipynb /#Contains Adam's exploratory notebook -jp-1-exploratory.ipynb -jp-2-modeling.ipynb -jp-3-stats-testing.ipynb -jp-4-maptime.ipynb -jp-exploratory1.ipynb /#Jacob's exploratory notebooks -dcm_exploratory_01.ipynb -dcm_exploratory_02.ipynb -dcm_exploratory_02a.ipynb -dcm_exploratory_porch_v_deck_price.ipynb /#Dann's exploratory notebooks -final.ipynb /#Contains final notebook https://github.com/Jprebys/mod2-project-group-3/blob/master/notebooks/final.ipynb
-refrences
/#Contains data dictionary https://github.com/Jprebys/mod2-project-group-3/tree/master/references -data_dictionary.pdf /#Document that provides clarification on what columns mean
-reports
/#Contains presented information https://github.com/Jprebys/mod2-project-group-3/tree/master/reports -figures /#contains .pds's of visualizations https://github.com/Jprebys/mod2-project-group-3/tree/master/reports/figures -Price by Outdoor Space.pdf /#Visualization illustrating types of porches and associated sale price -Price by Waterfront Access.pdf /#Vizualization illustrating average value of homes on waterfront vs not -Price by Zip Code.pdf /#Map of zip codes and average sale price in each zip code -presentation.pdf /#Presentation slides of porject presentation
-src
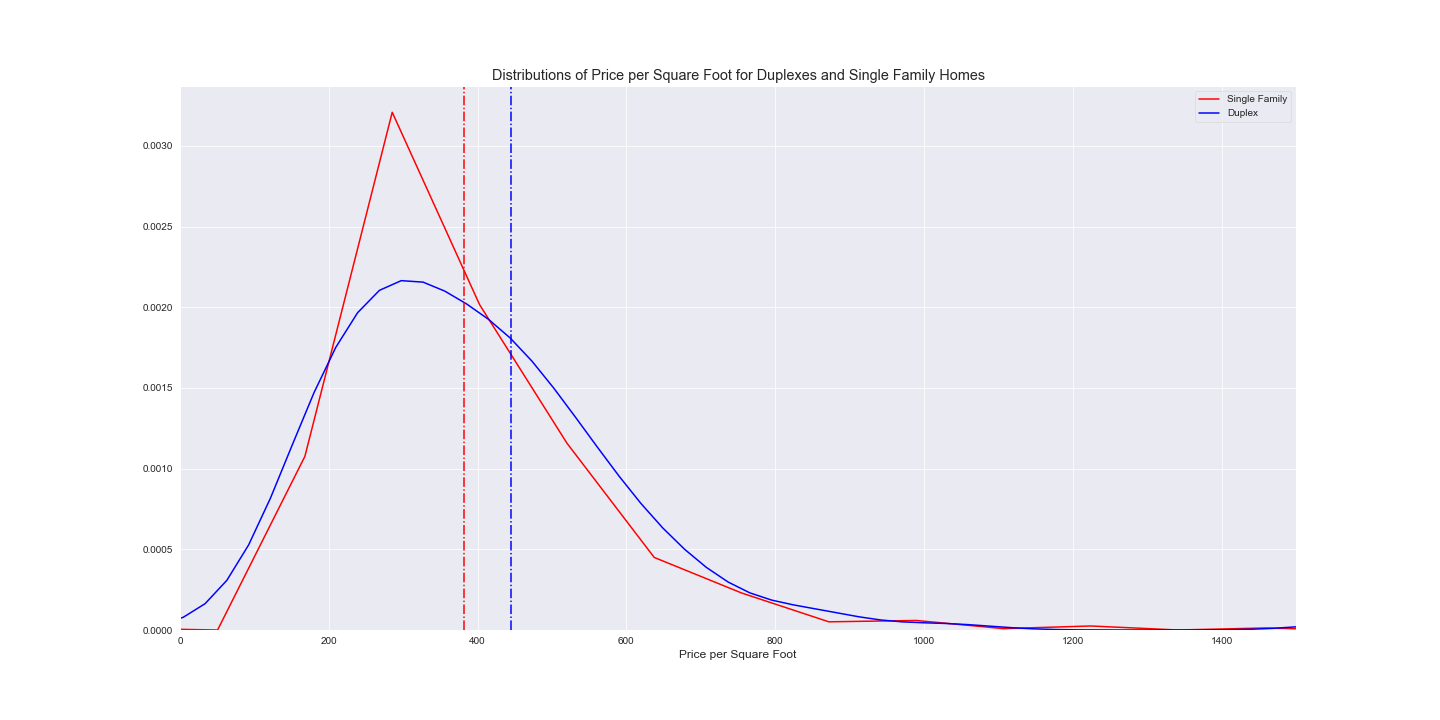
/#Contains visualization's of charts and maps https://github.com/Jprebys/mod2-project-group-3/tree/master/src -duplex.png /#A vizual illustrating the difference in $/square foot in houses vs duplexes -map.png -map_blue.png /#Maps illustrating cost of homes by zipcode in king county -regression.png /#A regression plot illustrating relationship between sale price and square footage
-.gitignore
/#The file that instructs git to ignore files https://github.com/Jprebys/mod2-project-group-3/blob/master/.gitignore
-README.md you are here
Our task was to find relationships between traits of homes and their sale price in King County, Washington to advise realestate investors and potential home buyers on what features may increase the value of their properties. For this analysis we focused on single family homes within King County that had a sale price greater than $0 and sold in the year 2019.
Our goal is to find traits of single family homes in King County that are correlated with a higher sale price. Specifically we looked into the location of homes, if they had a porch or not, number of bathrooms, and square footage to see if any of these were related to sale price.
Any hypothesis tests must have a p_value less than .05 to reject the null hypothesis.
Any regression models must have a R^2 value > .4 to be accepted.
The data sets used are all from the King County Department of Assessments (https://info.kingcounty.gov/assessor/DataDownload/default.aspx). Specifically Parcel (.ZIP), Real Property Sales (.ZIP), and Residential Building (.ZIP). This data contained infromation on all documented property sales within King County in 2019. This had been narrowed down to only single family homes that had sold for more than $0.
The python programming lanuage was used along with the libraries of pandas, numpy, matplotlib, seaborn, geopandas, scipy, and ols were used in this analysis. Pandas was used to create dataframes from the .csv files and isolate the variables and parameters we wanted to use for analysis. Matplotlib, seaborn, and geopandas were used to create the charts/ visualizations needed for insight and the presentation of our findings. Numpy, scipy, and ols were used for statistical tests and the creation of our regression models.
Our first model investigates the relationship between home squarefootage and sale price.
We found an R^2 value of .387, which is a little below the set threshold of .4. What this tells us is that squarefootage does have some affect on sale price, but the condition number is large (5.72EE3). This tells us that there are likely other factors at play other than the living space of the house
This led to a hypothesis test asking if duplexes have a lower price per square foot than single family homes. A one-tailed t-test netted a p value of .27, which is greater than the alpha threshold set of .05, leading to the null hypothesis not being rejected.
Our seccond model investigates the relationship between the number of bathrooms and sale price/
Similar to our squarefootge model, we found an R^2 value of .388, which is a little below the set threshold of .4. What this tells us is that squarefootage does have some affect on sale price, but the condition number is large (6.88EE3). This tells us that there are likely other factors at play other than the number of bathrooms.
Our thrid model illustrates the relationship between zip code (location) and sale price.
We found a R^2 value of .468, which is above our set threshold of .4. This tells us that we cna say with confidence that zipcode / area of the property clearly affects the sale price of homes. The highest sale price areas are Bellevue, Mercer Island, and Medina. The condition number is still quite large (1.51EE4), which tells us that there are still likely other factors influencing sale price.
The next explored claim was whether having a porch increases sale price versus not having a porch. A one-tailed t-test resulted in a low p value of 1.61EE-178. This is much lower than the set alpha value of .05, so we rejected the null hypothesis.
The final explored claim was if having waterfront access increases the sale price of homes.
A one-tailed t-test resulted in a low p value of 4.50EE-25. This is lower than the set alpha value of .05, so we rejected the null hypothesis.
What our results tell us is that when investing in the realestate of the King County area, one should looks for these traits in homes:
-On a waterfront -High squarefootage -Has a porch -Has multiple bathrooms -In the Bellevue, Mercer Island, or Medina areas
The next steps we wish to take are to look deeper into location's affect on the sale price of homes. Specifically we want to look at the distance between homes and various locations such as downtown or corporate offices.
Another things that should be noted with the bathrooms is that this data set did not include if the bathrooms had showers or baths. Perhaps checking the number of showers in a home could be more insightful than the number of bathrooms.


