- Docker
- Docker Compose V2
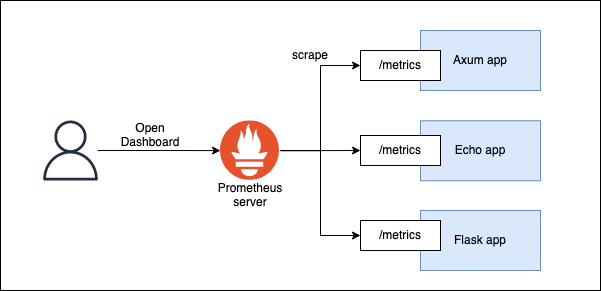
Three applications are running and Prometheus server scrapes them.
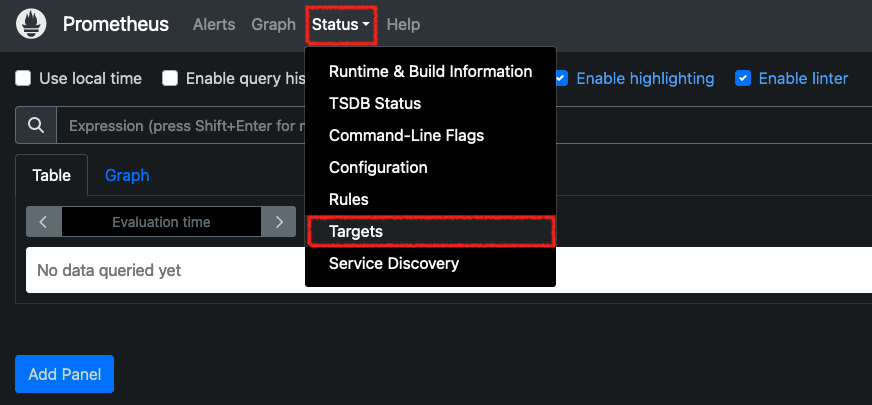
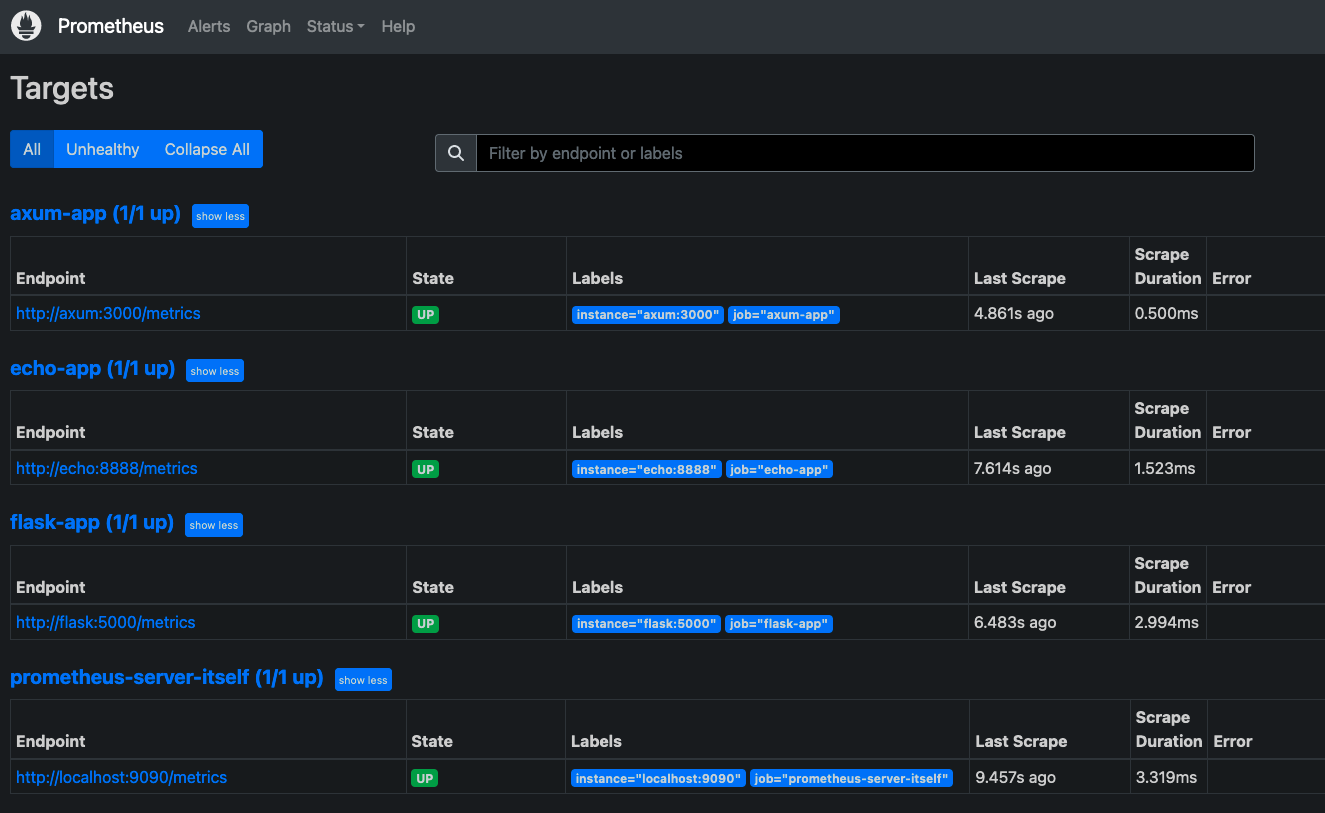
$ docker compose -f compose-prometheus.yaml upOpen http://localhost:80 and check all targets are up. Click Status -> Targets and see axum-app, echo-app, flask-app and prometheus-server-itself are up.
Flask application is running at port 5000, Echo applications is at port 8888 and Axum application is at port 3000. Send some requests to them.
# requests to Flask application
$ curl -XPOST http://localhost:5000/movies
{"movies":["movie42"]}
$ curl -XPOST http://localhost:5000/movies
{"movies":["movie42","movie10"]}
$ curl http://localhost:5000/movies
{"movies":["movie42","movie10"]}
# requests to Echo application
$ curl -XPOST http://localhost:8888/movies
[{"ID":881}]
$ curl -XPOST http://localhost:8888/movies
[{"ID":881},{"ID":947}]
$ curl -XPOST http://localhost:8888/movies
[{"ID":881},{"ID":947},{"ID":717}]
$ curl http://localhost:8888/movies
[{"ID":881},{"ID":947},{"ID":717}]
# requests to Axum application
$ curl -XPOST http://localhost:3000/movies
[{"id":18168806418232667828}]
$ curl -XPOST http://localhost:3000/movie
[{"id":18168806418232667828},{"id":16276746138974980245}]
$ curl http://localhost:3000/movies
[{"id":18168806418232667828},{"id":16276746138974980245}]
$ curl -XDELETE http://localhost:3000/movies/1
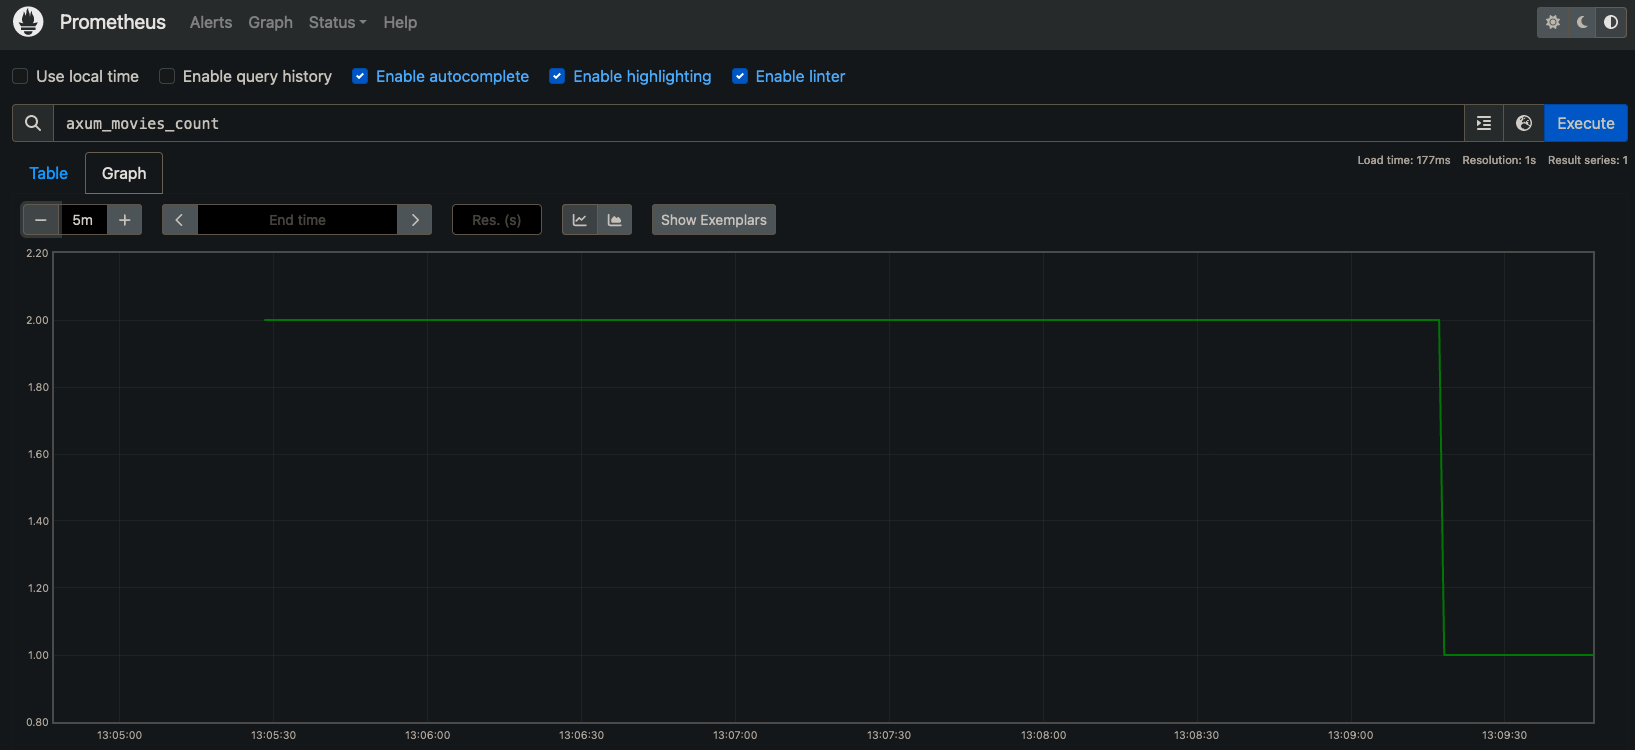
[{"id":18168806418232667828}]Execute PromQL like axum_movies_count and now you can see metrics graph.
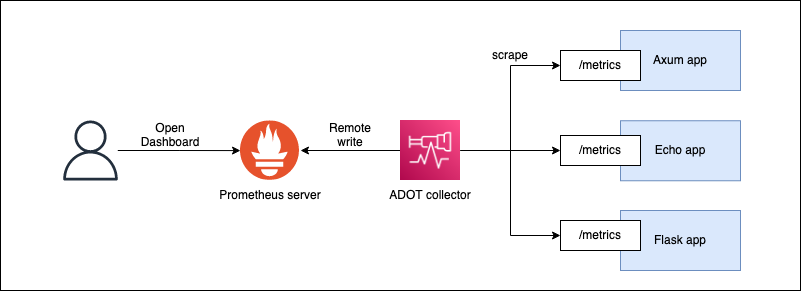
$ docker compose -f compose-prometheus.yaml downThree applications are running and OpenTelemetry collector scrapes them, then it remote writes to Prometheus server.
$ docker compose -f compose-adot-collector.yaml upYou can see only prometheus-server-itself in targets.
Flask application is running at port 5000, Echo applications is at port 8888 and Axum application is at port 3000. Send some requests to them.
# requests to Flask application
$ curl -XPOST http://localhost:5000/movies
{"movies":["movie42"]}
$ curl -XPOST http://localhost:5000/movies
{"movies":["movie42","movie10"]}
$ curl http://localhost:5000/movies
{"movies":["movie42","movie10"]}
# requests to Echo application
$ curl -XPOST http://localhost:8888/movies
[{"ID":881}]
$ curl -XPOST http://localhost:8888/movies
[{"ID":881},{"ID":947}]
$ curl -XPOST http://localhost:8888/movies
[{"ID":881},{"ID":947},{"ID":717}]
$ curl http://localhost:8888/movies
[{"ID":881},{"ID":947},{"ID":717}]
# requests to Axum application
$ curl -XPOST http://localhost:3000/movies
[{"id":18168806418232667828}]
$ curl -XPOST http://localhost:3000/movie
[{"id":18168806418232667828},{"id":16276746138974980245}]
$ curl http://localhost:3000/movies
[{"id":18168806418232667828},{"id":16276746138974980245}]
$ curl -XDELETE http://localhost:3000/movies/1
[{"id":18168806418232667828}]Execute PromQL like axum_movies_count and now you can see metrics graph.
$ docker compose -f compose-adot-collector.yaml down