Do you know this feeling? - Something in your data broke, you patiently added monitoring to detect that in the future... only so, that the next time different not expected thing went wrong :)
Redata is monitoring system for data teams. Automatically computing health checks on all your tables, visualizing them over time, and alerting on them.
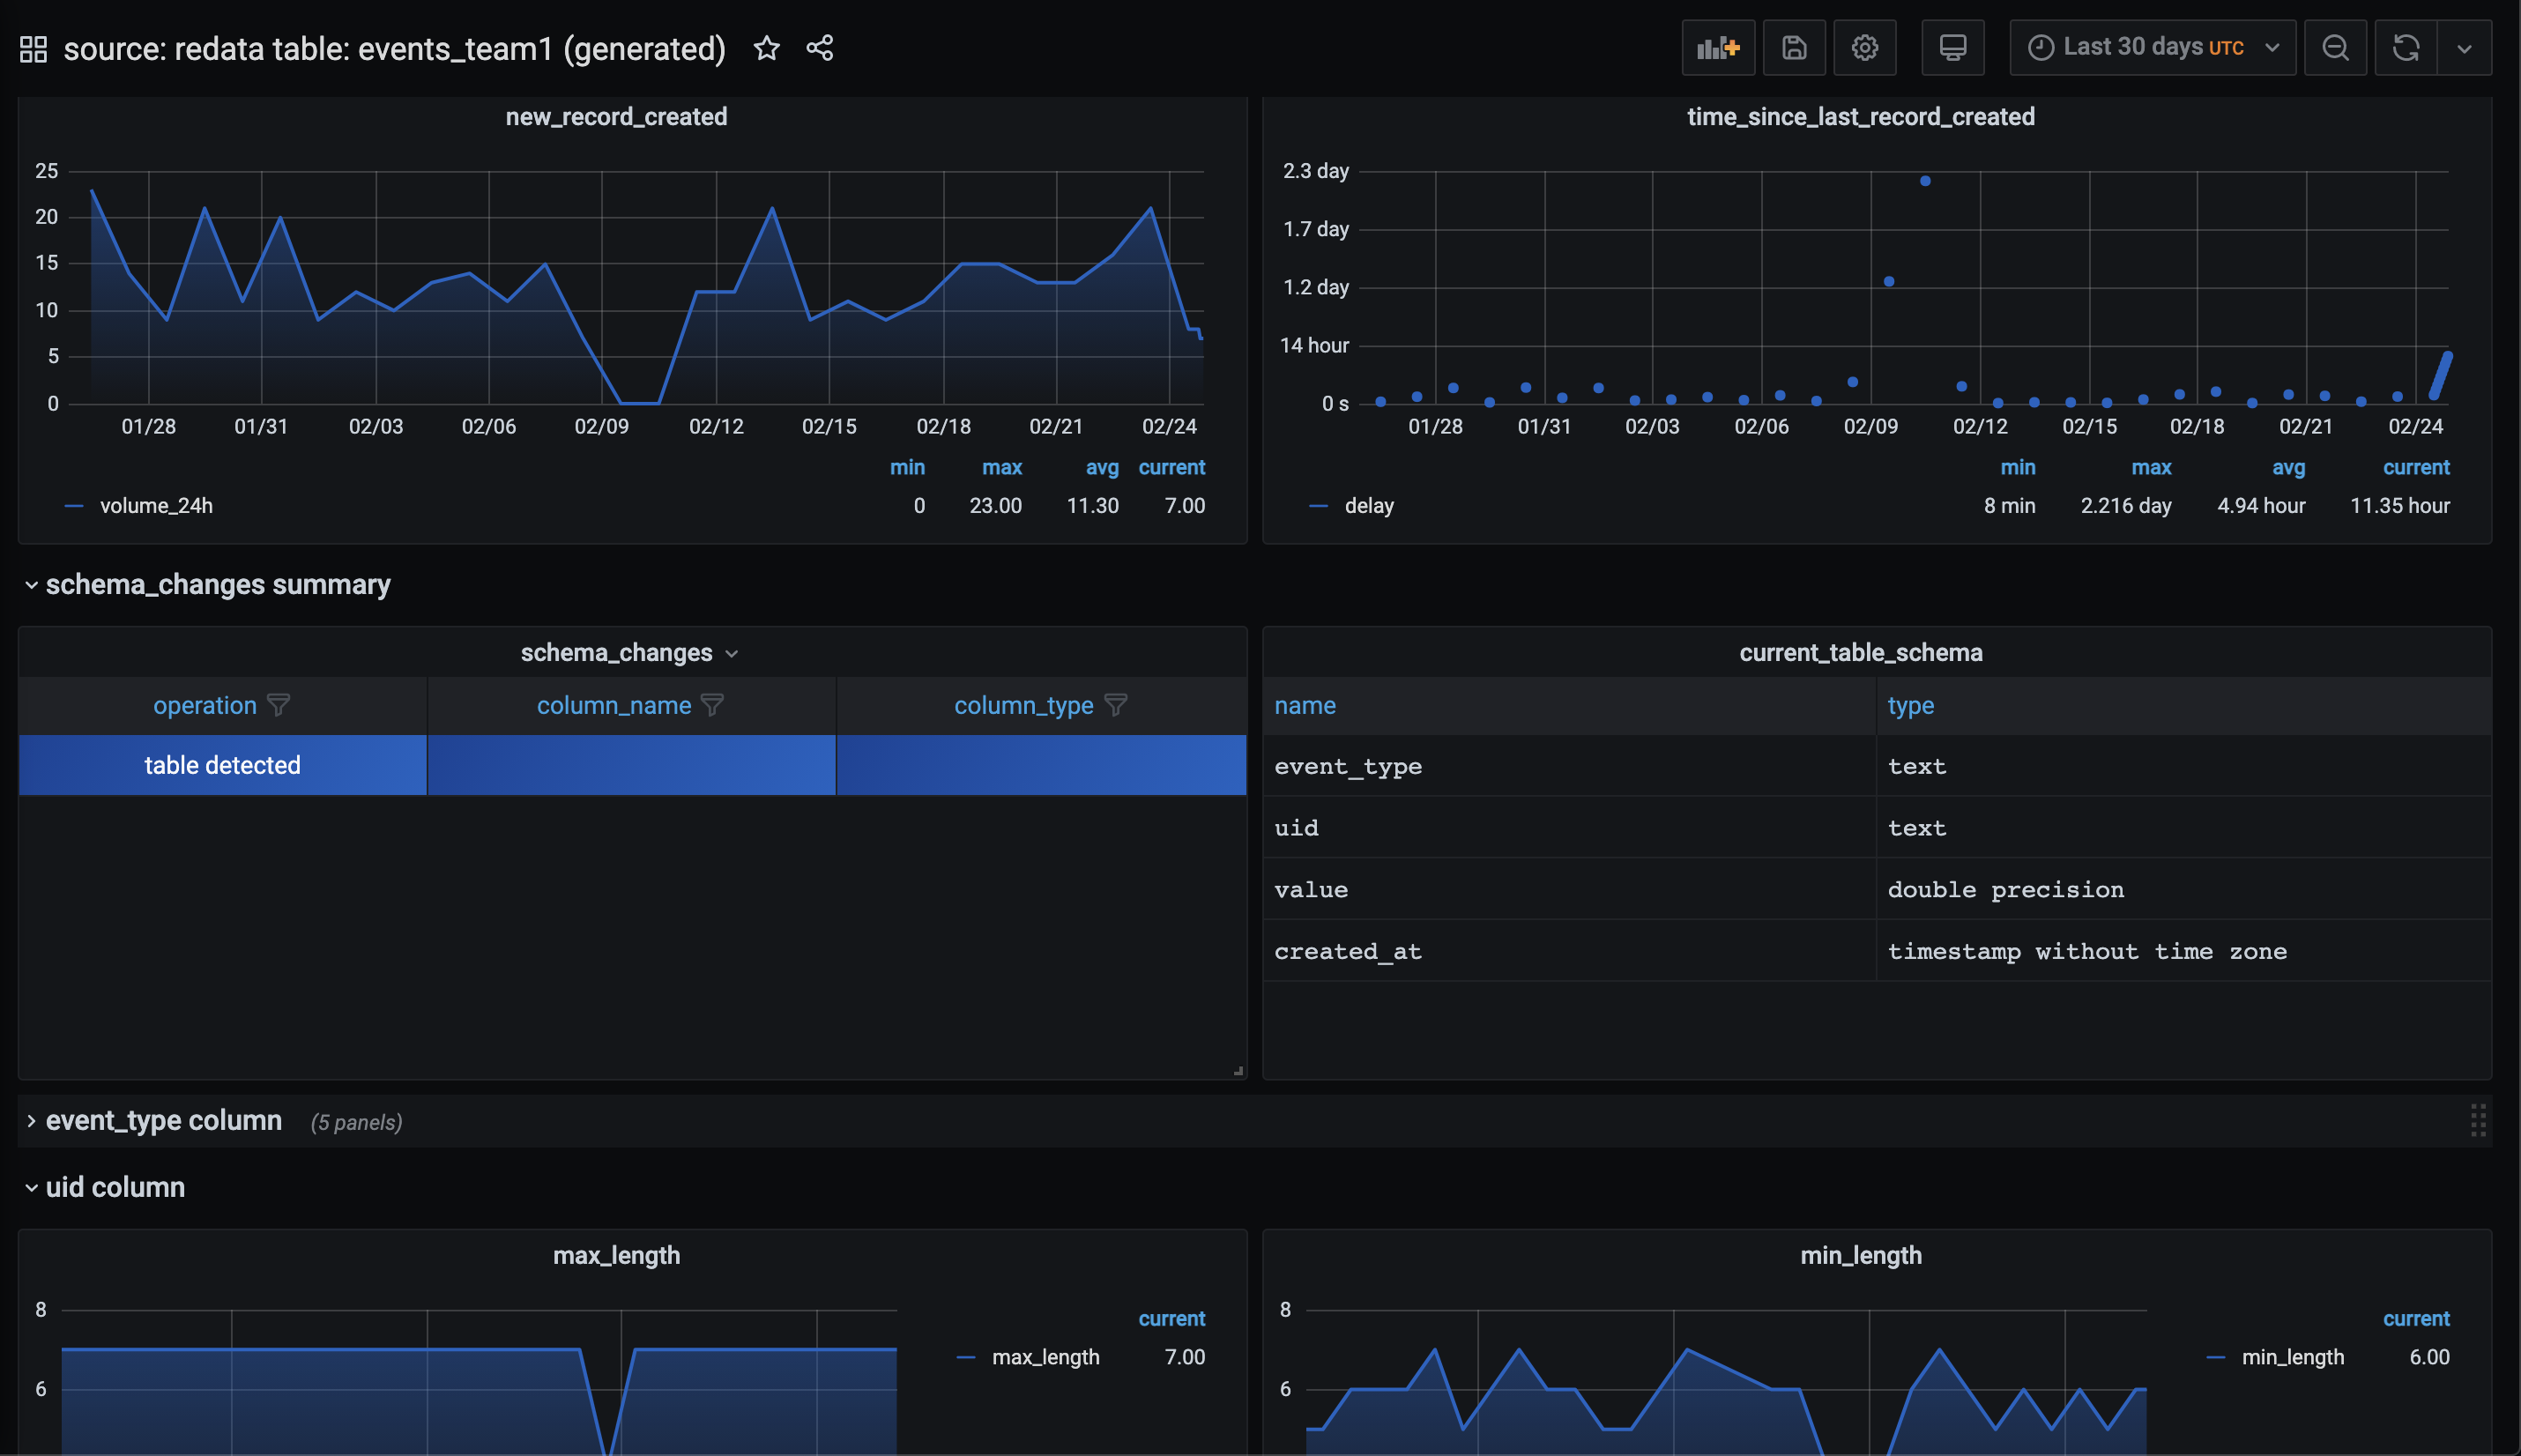
Redata computes health metrics for your data, containing information like this:
- time since last record was added
- number of records added in last (hour/day/week/month)
- schema changes that recently happened
- number of missing values in columns over time
- min/max/avg of values and lenghts of strings in colums
- other user defined metrics
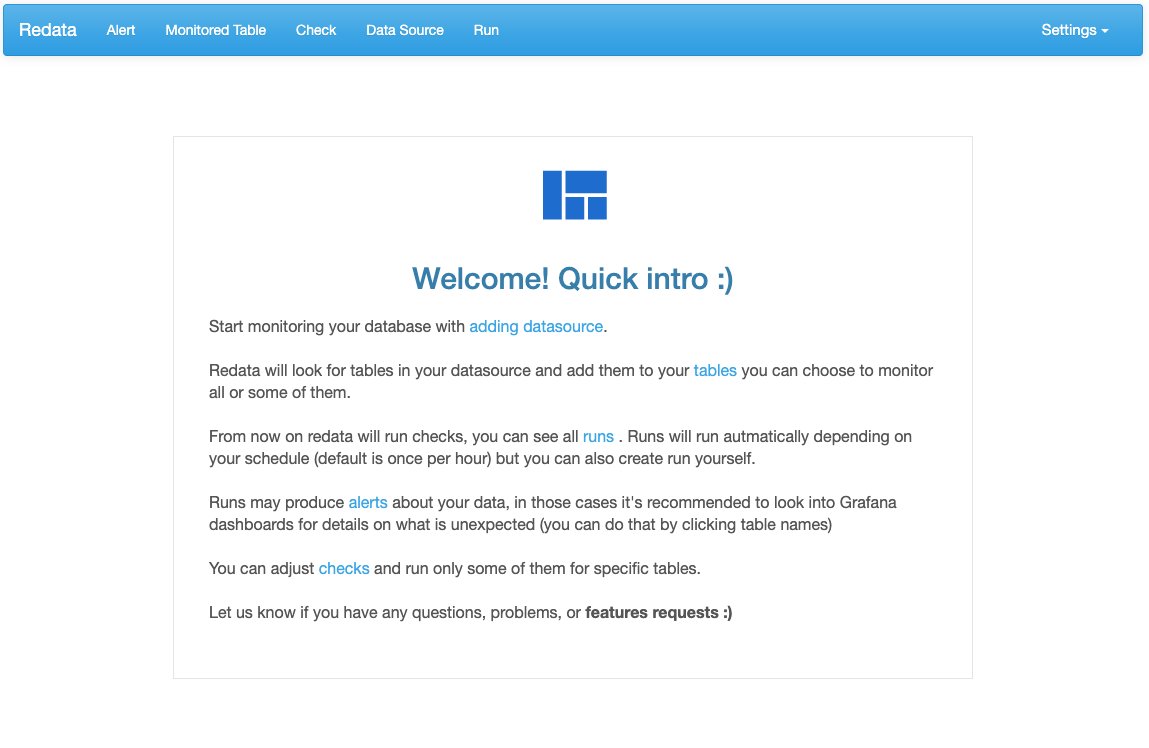
Redata UI enables you to view all your tables, their health and alerts of unexpected situations. You can also adjust checks generated by Redata here.
Having metrics in one common format makes it possible to create table health dashboards automatically Here are some examples of how Grafana dashboards look like:
Redata compares metrics computed in the past to current metrics and alerts if anomalies are found. This means that situations like this:
- sudden drops or increases in the volume of new records added to your tables
- longer than expected break between data arrivals
- significantly different maximal/minimal/avg numbers in any of table columns
- and more
Would be detected, and you will be alerted. Redata supports Slack (with others tools possible to integerate for you via Grafana) so you can also set up alerts to your favorite support channel.
What are benefits of using Redata instead of implementing data monitoring yourself? Here is a our list :)
-
UI showing health of your tables - See your tables and their health easily
-
Automatic and up to date health dashboards - It's normally quite cumbersome to setup proper monitoring for all tables and keeping it up to date is hard - redata can do that for you, detecting new tables and columns and automatically creating dashboards/panels for them.
-
Smart alerts - Once tables are detected redata automatically tracks their health and looks for anomalies there. Alerts are designed specifically for data quality checks and separete from Grafana alerts (no limits on what to alert on, etc.)
-
Visualizing new, previously impossible things - Things like schema changes, cannot be queried from DB, redata compares snapshots of your schemas and alert if this change
-
Big set of predefined and effectively computed metrics - Redata comes with large set of predefined metrics, computed out of box for your tables. We also optimize queries computing them, so that it's effective and fast.
git clone https://github.com/redata-team/redata.git
cd redata

docker-compose up
Now visit http://localhost:5000, add your database and start monitoring your data. Default password/user for Redata/Grafana app is redata :)
Redata uses docker and docker-compose for deployment, this makes it easy to deploy in the cloud, or in your on premise enviroment.
Look at sample setup instructions for specfic cloud providers:
Join Slack for general questions about using redata, problems, and discussions with people making it :)
Here are integrations we support. If your stack is not yet here, feel free to submit issue for it :)
| Integration | Status | |
|---|---|---|
| PostgreSQL | Supported | |
| MySQL | Supported | |
| Exasol | Supported | |
| BigQuery | Supported | |
| Apache Airflow | Supported, view all your checks in Airflow | |
| Grafana | Supported, view metrics here | |
| Slack | Supported, get alerts on Slack | |
| Other SQL DBs | Experimental support via using SQLAlchemy | |
| AWS Redshift | Supported | |
| Snowflake | Supported | |
| SQL Server | Supported | |
Redata is licensed under the MIT license. See the LICENSE file for licensing information.
Want to learn a bit more on how Redata works. We recommend starting with data source which explains how to configure you DB. Later on table, scan, alert are views you most likely will be checking first when using Redata. Checks are coputing all metrics in Redata, you can edit them to stop computing some of them, but also add your own SQL based checks.
We love all contributions, bigger and smaller.
Checkout out current list of issues here and see if you like anything from there. Also feel welcome to join our Slack and suggest ideas, or setup no pressure session with Redata here.
General info about contriuting is here
If you would like to add support for your DB more info on that is here
And if you got this far and like what we are building, support us! Star https://github.com/redata-team/redata on Github :)


