Learning alorithmic trading
This short intro is intended to inspire. Getting profficient takes years.
Download and install Python
https://www.python.org/downloads/
Install the necessary packages:
$ pip install -U requests finplot
Requirement already satisfied: requests in c:\prog\python311\lib\site-packages (2.28.1)
Collecting requests
  Downloading requests-2.28.2-py3-none-any.whl (62 kB)
     ━━━━━━━━━━━━━━━━━━━━━━━━━━━━━━━━━━━━━━━━ 62.8/62.8 kB 177.6 kB/s eta 0:00:00
Requirement already satisfied: finplot in c:\prog\python311\lib\site-packages (1.9.0)
Requirement already satisfied: charset-normalizer<4,>=2 in c:\prog\python311\lib\site-packages (from requests) (2.1.1)
Requirement already satisfied: idna<4,>=2.5 in c:\prog\python311\lib\site-packages (from requests) (3.4)
Requirement already satisfied: urllib3<1.27,>=1.21.1 in c:\prog\python311\lib\site-packages (from requests) (1.26.13)
Requirement already satisfied: certifi>=2017.4.17 in c:\prog\python311\lib\site-packages (from requests) (2022.12.7)
Requirement already satisfied: numpy>=1.23.5 in c:\prog\python311\lib\site-packages (from finplot) (1.23.5)
Requirement already satisfied: pandas>=1.5.2 in c:\prog\python311\lib\site-packages (from finplot) (1.5.2)
Requirement already satisfied: PyQt6>=6.4.0 in c:\prog\python311\lib\site-packages (from finplot) (6.4.1)
Requirement already satisfied: pyqtgraph>=0.13.1 in c:\prog\python311\lib\site-packages (from finplot) (0.13.1)
Requirement already satisfied: python-dateutil in c:\prog\python311\lib\site-packages (from finplot) (2.8.2)
Requirement already satisfied: pytz>=2020.1 in c:\prog\python311\lib\site-packages (from pandas>=1.5.2->finplot) (2022.6)
Requirement already satisfied: PyQt6-sip<14,>=13.4 in c:\prog\python311\lib\site-packages (from PyQt6>=6.4.0->finplot) (13.4.0)
Requirement already satisfied: PyQt6-Qt6>=6.4.0 in c:\prog\python311\lib\site-packages (from PyQt6>=6.4.0->finplot) (6.4.1)
Requirement already satisfied: six>=1.5 in c:\prog\python311\lib\site-packages (from python-dateutil->finplot) (1.16.0)
Installing collected packages: requests
  Attempting uninstall: requests
    Found existing installation: requests 2.28.1
    Uninstalling requests-2.28.1:
      Successfully uninstalled requests-2.28.1
Successfully installed requests-2.28.2

[notice] A new release of pip available: 22.3.1 -> 23.0
[notice] To update, run: python.exe -m pip install --upgrade pip
Start python
Start the interactive python prompt:
$ python
Python 3.11.1 (tags/v3.11.1:a7a450f, Dec  6 2022, 19:58:39) [MSC v.1934 64 bit (AMD64)] on win32
Type "help", "copyright", "credits" or "license" for more information.
>>>
The reason we're using interactive mode is to get instant feedback of what we're doing instead of the whole edit-write-save-run cycle.
Start coding
Import dependencies
import finplot as fplt # for finance plotting
import pandas as pd    # for data manipulation
import requests        # for fetching data over http
Download data
coin = 'BTCUSDT'
url = f'https://www.binance.com/api/v1/klines?symbol={coin}&interval=1d&limit=1000'
klines = requests.get(url).json()
print(klines[0]) # inspect first row
This should print something like:
[1590105600000, '9067.51000000', '9271.00000000', '8933.52000000', '9170.00000000', '58943.13102400', 1590191999999, '537847834.49670863', 693694, '28987.31589600', '264538897.25902512', '0']The variable klines contains "klines," of 1 day resolution. So the above is: starting time (milliseconds), open price,
high price, low price, close price, closing time, volume and so on for each candle.
The other fields are not of importance to us. We'll put this in a Pandas DataFrame, which consists of a number of rows where each column constitutes a bunch of these fields.
Arrange and format the data
columns = 'time open high low close volume close_time qvol trade_count taker_base taker_quote ignore'.split()
df = pd.DataFrame(klines, columns=columns)
df = df.astype({'time':'datetime64[ms]', 'open':float, 'close':float, 'high':float, 'low':float, 'volume':float})
print(df)
The printout of the data frame df should look something like this:
          time      open      high       low     close         volume     close_time                 qvol  trade_count       taker_base          taker_quote ignore
0   2020-05-22   9067.51   9271.00   8933.52   9170.00   58943.131024  1590191999999   537847834.49670863       693694   28987.31589600   264538897.25902512      0
1   2020-05-23   9170.00   9307.85   9070.00   9179.15   43526.296966  1590278399999   400407195.62892234       512460   21377.61633200   196682791.17593565      0
2   2020-05-24   9179.01   9298.00   8700.00   8720.34   70379.866450  1590364799999   636787240.37332477       774088   32046.41144400   290362268.47214719      0
3   2020-05-25   8718.14   8979.66   8642.72   8900.35   62833.910949  1590451199999   553545285.91401386       733557   30771.88874400   271166770.94493836      0
4   2020-05-26   8900.35   9017.67   8700.00   8841.18   58299.770138  1590537599999   516455128.89068804       678304   28242.17008300   250278944.16497476      0
..         ...       ...       ...       ...       ...            ...            ...                  ...          ...              ...                  ...    ...
995 2023-02-11  21625.19  21906.32  21599.78  21862.55  177021.584330  1676159999999  3842000897.79758020      4207940   87937.95970000  1908638569.77981010      0
996 2023-02-12  21862.02  22090.00  21630.00  21783.54  204435.651630  1676246399999  4469822441.43720180      4561903  101194.34699000  2212545781.09311440      0
997 2023-02-13  21782.37  21894.99  21351.07  21773.97  295730.767910  1676332799999  6404813758.26962980      6503611  147221.38569000  3188732830.19944260      0
998 2023-02-14  21774.63  22319.08  21532.77  22199.84  361958.401090  1676419199999  7938385476.79208380      7695927  182006.71562000  3991901041.90238260      0
999 2023-02-15  22199.84  22916.98  22047.28  22838.88  218138.849840  1676505599999  4890970539.87517120      4721264  109141.43279000  2447142280.38711080      0

[1000 rows x 12 columns]
The first column is the index of the data frame (0-999). The next five ones contains the data we are mostly interested in.
Plot a candlestick chart
df[['time','open','close','high','low']].plot(kind='candle')
fplt.show()
Try out some trading strategy
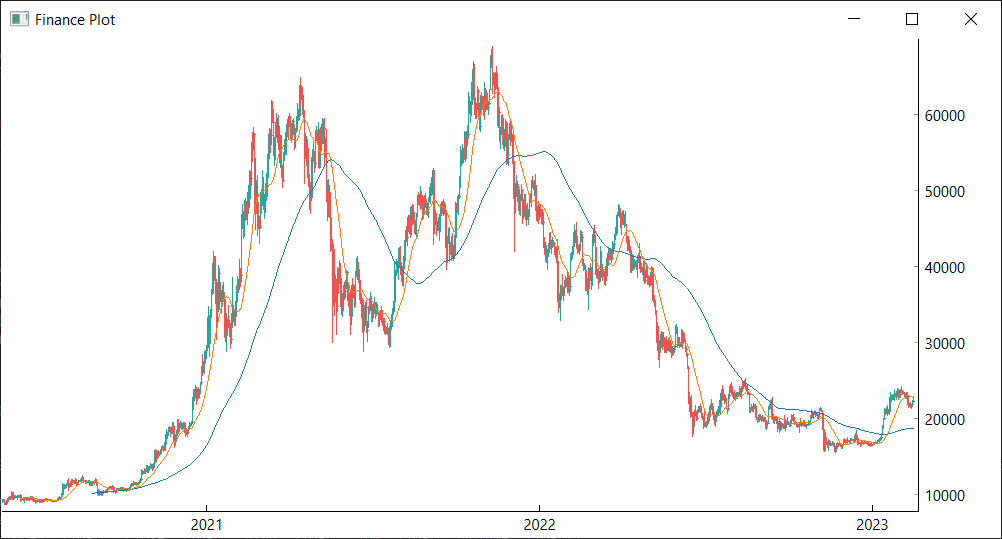
Let's just try the trivial "SMA" (simple moving average) strategy
df['time open close high low'.split()].plot(kind='candle')
df.close.rolling(99).mean().plot()
df.close.rolling(20).mean().plot()
fplt.show()
The full program
import finplot as fplt # for finance plotting
import pandas as pd    # for data manipulation
import requests        # for fetching data over http


coin = 'BTCUSDT'
url = f'https://www.binance.com/api/v1/klines?symbol={coin}&interval=1d&limit=1000'
klines = requests.get(url).json()
print(klines[0]) # inspect first row

columns = 'time open high low close volume close_time qvol trade_count taker_base taker_quote ignore'.split()
df = pd.DataFrame(klines, columns=columns)
df = df.astype({'time':'datetime64[ms]', 'open':float, 'close':float, 'high':float, 'low':float, 'volume':float})
print(df)

df[['time','open','close','high','low']].plot(kind='candle')
df.close.rolling(99).mean().plot()
df.close.rolling(20).mean().plot()
fplt.show()