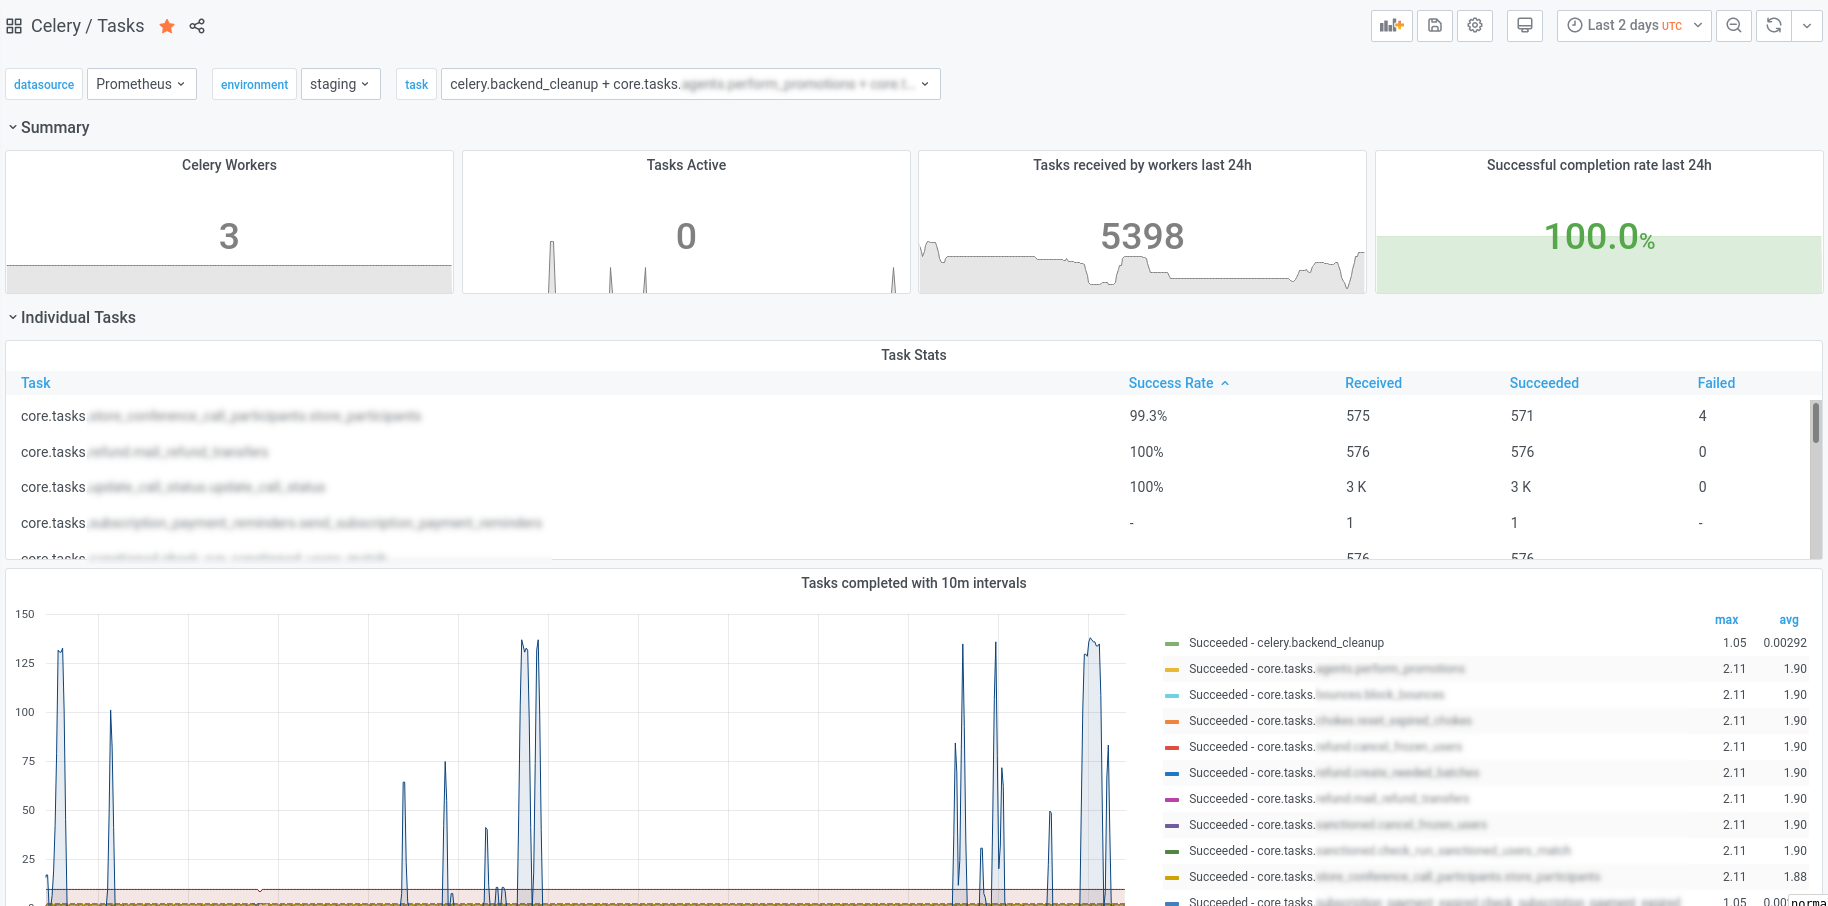
While I was adding Celery monitoring to a client site I realized that the existing brokers either didn't work, exposed incorrect metric values or didn't expose the metrics I needed. So I wrote this exporter which essentially wraps the built-in Celery monitoring API and exposes all of the event metrics to Prometheus in real-time.
- Uses the built in real-time monitoring component in Celery to expose Prometheus metrics
- Tracks task status (task-started, task-succeeded, task-failed etc)
- Tracks which workers are running and the number of active tasks
- Follows the Prometheus exporter best practises
- Works with both Redis and RabbitMQ
- Deployed as a Docker image or Python single-file binary (via PyInstaller)
- Exposes a health check endpoint at /health
- Grafana dashboards provided by the Celery-mixin
- Prometheus alerts provided by the Celery-mixin
Alerting rules can be found here. By default we alert if:
- A task failed in the last 10 minutes.
- No Celery workers are online.
Tweak these to suit your use-case.
The Grafana dashboard (seen in the image above) is here. You can import it directly into your Grafana instance.
Celery needs to be configured to send events to the broker which the exporter will collect. You can either enable this via Celery configuration or via the Celery CLI.
To enable events in the CLI run the below command. Note that by default it
doesn't send the task-sent event which needs to be configured in the
configuration. The other events work out of the box.
$ celery -A <myproject> control enable_eventsEnable events using the configuration:
# In celeryconfig.py
worker_send_task_events = True
task_send_sent_event = True
Configuration in Django:
# In settings.py
CELERY_WORKER_SEND_TASK_EVENTS = True
CELERY_TASK_SEND_SENT_EVENT = TrueUsing Docker:
docker run -p 9808:9808 danihodovic/celery-exporter --broker-url=redis://redis.service.consul/1Using the Python binary (for-non Docker environments):
curl -L https://github.com/danihodovic/celery-exporter/releases/download/latest/celery-exporter -o ./celery-exporter
chmod+x ./celery-exporter
./celery-exporter --broker-url=redis://redis.service.consul/1Head over to the Celery-mixin in this subdirectory to generate rules and dashboards suited to your Prometheus setup.
| Name | Description | Type |
|---|---|---|
| celery_task_sent_total | Sent when a task message is published. | Counter |
| celery_task_received_total | Sent when the worker receives a task. | Counter |
| celery_task_started_total | Sent just before the worker executes the task. | Counter |
| celery_task_succeeded_total | Sent if the task executed successfully. | Counter |
| celery_task_failed_total | Sent if the execution of the task failed. | Counter |
| celery_task_rejected_total | The task was rejected by the worker, possibly to be re-queued or moved to a dead letter queue. | Counter |
| celery_task_revoked_total | Sent if the task has been revoked. | Counter |
| celery_task_retried_total | Sent if the task failed, but will be retried in the future. | Counter |
| celery_worker_up | Indicates if a worker has recently sent a heartbeat. | Gauge |
| celery_worker_tasks_active | The number of tasks the worker is currently processing | Gauge |
| celery_task_runtime | Histogram of runtime measurements for each task | Histogram |
