This repository hasn't been updated for some time. In the meantime I started a similar project to get out of library dependency. Have a look at timeseries.js.
just some simple javascript widgets for customizable zabbix dashboards
The widgets provide a very simple way to easily integrate zabbix information on your own dashboard. It just uses javascript (jquery, d3, jqzabbix) and the zabbix api to create self-updating animated tables and graphs. Have a look at the demo.
- copy the files to your document root
- provide the zabbix api url and credentials in samples.html (https:///zabbix/api_jsonrpc.php)
- for zabbix < 2.4: provide the zabbix patch for cross site requests (https://support.zabbix.com/browse/ZBXNEXT-1377)
- for saving bandwidth don't forget to enable gzip compression for api calls (usually about 95%)
- for saving bandwidth zabbix > 3 allows the use of trend.get(). For older versions there's a patch for the trend.get() api call is available (https://support.zabbix.com/browse/ZBXNEXT-1193)
- clone repository / download zip
- open
samples.htmlin the web browser of your choice.
the samples.html is pre-configured to access a demo Zabbix instance located on zabbix.org and shows a sample for each widget.
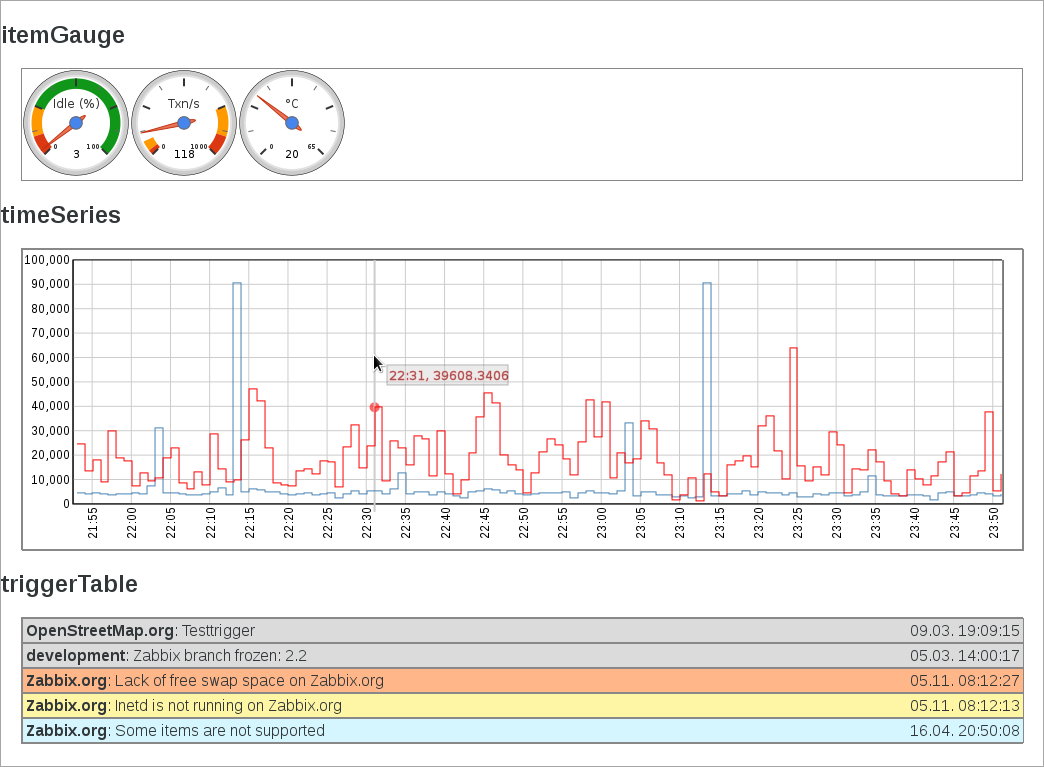
itemGauge shows the last value of a Zabbix item and is refreshed according to the item's update interval. The widget is currently only a wrapper around Tomer Doron's google style gauges using d3.js.
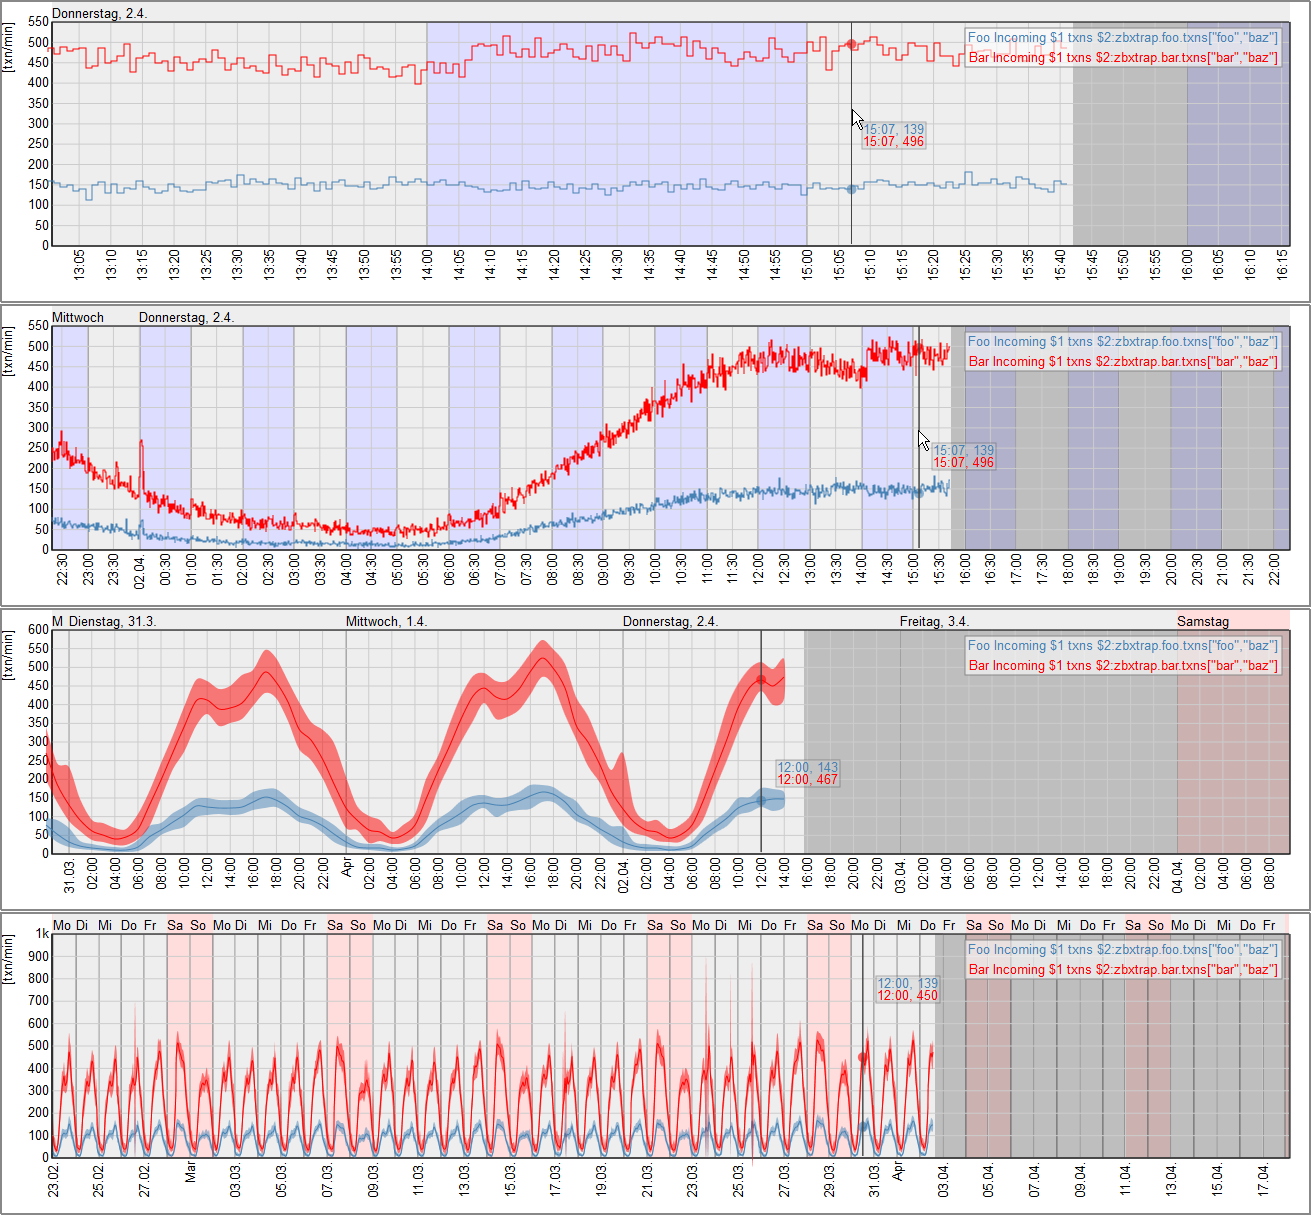
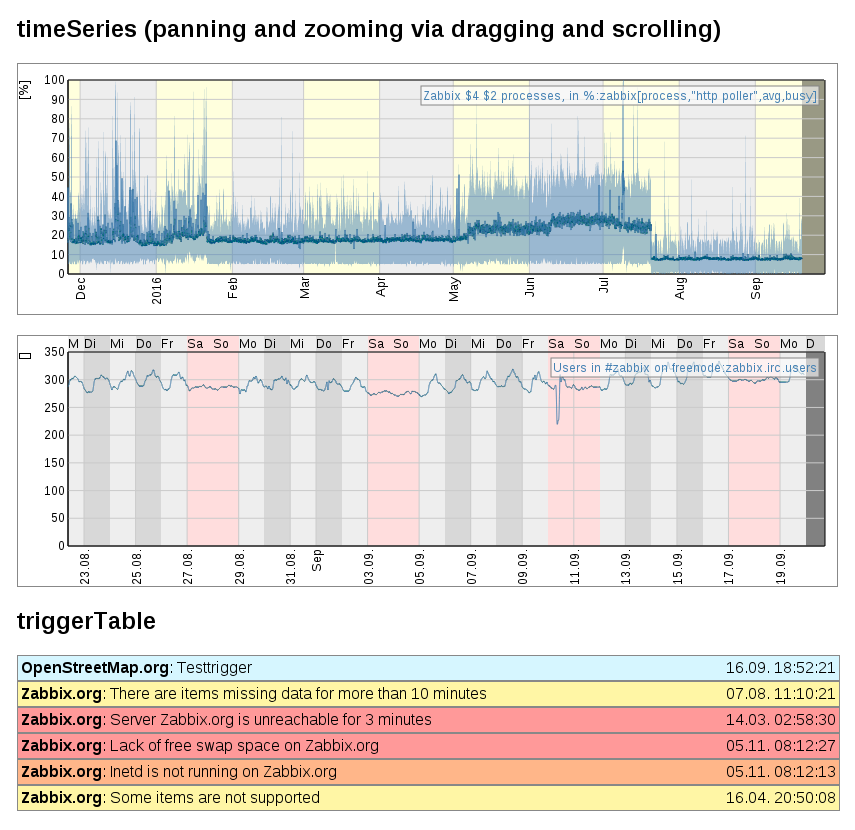
timeSeries is a widget to diplay timeseries data from zabbix in a simple to use graph. Intuitive scrolling and panning is provided in realtime doing api calls in the background. When zooming out for several days the trend.get() api call is used to receive data in lower detail.
triggerTable displays all alerting zabbix triggers in an animated table. Animations draw the user's attention to the dashboard when changes occur.
A simple function for flickerfree image reloads in dashboards. Provide the image's container id (not the id of the image itself) and the refresh interval in seconds. After each timeout the image url will be modified by appending '&refresh=' and then reloaded in the background. As soon as the image is loaded it will be replaced resulting in flickerfree image updates. This works with one image per element only.
timeSeries is a class with a high potential for more features. This has to be done very carefully: performance is a critical issue here, transition animations quickly drive the browser to its limits. A gant chart for events is planned. This will be very usefull for problem correlations.
- http://www.zabbix.com
- http://d3js.org
- https://github.com/mbostock/d3
- https://github.com/kodai/jqzabbix