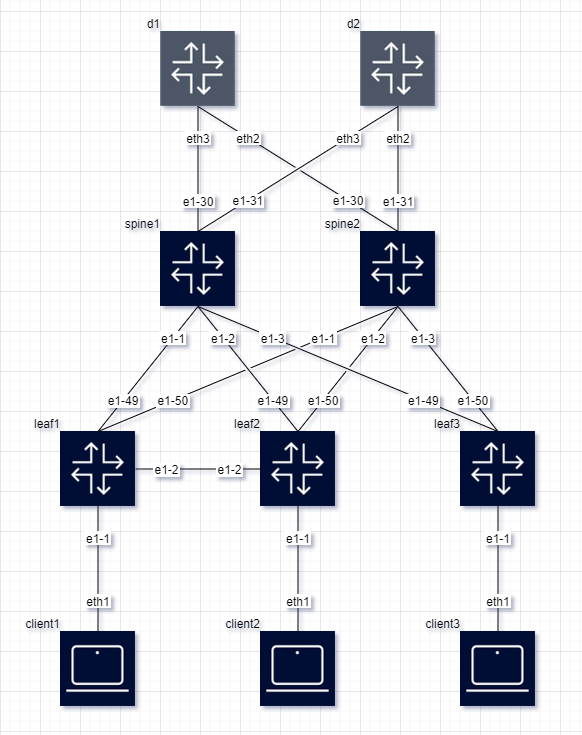
containerlab2diagram is a tool designed to automatically generate network topology diagrams from Containerlab YAML files, rendering them into visually appealing diagrams using Draw.io. This tool simplifies the process of visualizing network designs and configurations, making it easier for network engineers and architects to document and share their containerlab environments.
If you need the opposite, to generate a Containerlab (clab) file from a draw.io drawing, drawio2clab has you covered.
- Automatic Diagram Generation: Converts containerlab YAML configurations into detailed Draw.io diagrams.
- Intelligent Node Placement: Attempts to determine the best placement for nodes automatically. However, for complex topologies, this can be challenging.
- Graph-level-Based Layout: Organizes nodes into graph-level based on their connectivity for clearer topology visualization. Users can influence node placement by specifying graph-level directly in the containerlab configuration.
- Graph-icon Support: Enhances node visualization by allowing users to specify graph-icon labels such as router, switch, or host to define custom icons for nodes in the generated diagrams.
- Customizable Styles: Supports customization of node and link styles within the diagrams.
To simplify dependency management and execution, containerlab2diagram can be run inside a Docker container. Follow these instructions to build and run the tool using Docker.
docker pull flosch62/containerlab2diagram:latestNavigate to the project directory and run:
docker build -t containerlab2diagram .This command builds the Docker image of containerlab2diagram with the tag containerlab2diagram, using the Dockerfile located in the docker/ directory.
Run containerlab2diagram within a Docker container by mounting the directory containing your .drawio files as a volume. Specify the input and output file paths relative to the mounted volume:
docker run -v "$(pwd)":/data flosch62/containerlab2diagram --output-dir /data/ /data/your_input_file.yamlReplace your_input_file.drawio with the name of your actual file. This command mounts your current directory to /data inside the container.
Clone the repository to your local machine:
git clone https://github.com/FloSch62/containerlab2diagram.git
cd containerlab2diagram
Ensure you have Python 3.x installed on your system. You can then install the required dependencies:
pip install -r requirements.txtTo generate a network topology diagram from a containerlab YAML file, run the following command:
python containerlab2diagram.py <path_to_your_yaml_file>The output will be a Draw.io diagram file saved in the ./Output directory. You can open this file with Draw.io to view and further edit your network topology diagram.
The tool attempts to determine the best placement for nodes automatically. However, achieving an optimal layout for complex topologies might be challenging. You can influence the behavior by setting the graph-level as a label in the containerlab file. This approach impacts the vertical placement of nodes in the generated diagram, where a lower graph-level number (e.g., graph-level: 1) indicates a position towards the top of the canvas, and a higher graph-level number will place the node further down the canvas. This feature allows you to suggest a specific vertical hierarchy for each node, aiding the tool in organizing the topology more effectively.
Example configuration to set node graph-level:
client1:
  kind: "linux"
  labels:
    graph-level: 1 # This node will be placed towards the top of the canvas
    graph-icon: host # This node will use the client icon
spine1:
kind: "linux"
labels:
graph-level: 2 # This node will be placed below graph-level 1 nodes on the canvas
graph-icon: switch # This node will use the switch iconUsing graph-level helps manage the vertical alignment of nodes in the generated diagram, making it easier to visualize the hierarchical structure of your network.
containerlab2diagram supports several command-line arguments to customize the diagram generation process. Use these arguments to fine-tune the output according to your specific requirements:
filename: The path to your containerlab YAML file. This argument is required to specify the input file for diagram generation.
python containerlab2diagram.py <path_to_your_yaml_file>--include-unlinked-nodes: Include nodes that do not have any links in the topology diagram. By default, only nodes with at least one connection are included.
python containerlab2diagram.py --include-unlinked-nodes <path_to_your_yaml_file>--no-links: Generate the diagram without drawing links between nodes. This option is useful for focusing on node placement or when the connectivity between nodes is not relevant.
python containerlab2diagram.py --no-links <path_to_your_yaml_file>--output-dir: Specify the output directory for the generated diagram. By default, the diagram is saved in the ./Output directory.
python containerlab2diagram.py --output-dir <path_to_output_directory> <path_to_your_yaml_file>The tool allows for basic customization of node and link styles within the generated diagram. To customize, edit the custom_styles dictionary within the containerlab2diagram.py file according to your preferences.
