English | 简体中文


Automatic insights extraction and visualization specification based on visual-insights.
Rath helps you extract insights from datasource automatically and generate interactive visualization with interesting findings.
Here are main parts in Rath,
dataSource board is for data uploading, sampling(currently support stream data, which means there is no limit of the size of file you uploaded), cleaning and defining fields type(dimensions, measures). In visual insights, we regard dimensions as independent variable or feature and measures as dependent variable or target.
Notebook is a board for user to know what happened in the automatic analysis process and how rath uses visual-insights. It shows how decisions are made by the application and provide interactive interface to adjust some of the parameters and operators used by the algorithm.
Gallery displays parts of the visualization with interesting findings. In Gallery, you can find interesting visualizaiton and use association feature to find more related visualization. You can also search specific info in gallery. There are some settings here to adjust some of the visual elements in the chart.
automantic generate dashboard for you. rath will figure out a set of visulization of which contents are connected to each other and can be used to analysis a specific problem.
Details of the test result can be accessed here
(dev)
# under project root dir
yarn workspace visual-insights build

yarn workspace frontend start

yarn workspace backend dev

# localhost:3000
production mode
yarn workspace visual-insights build

yarn workspace frontend build

yarn workspace backend dev

# server:8000
only use the algorithm package. (/packages/visual-insights)

npm i visual-insights --save`The working process are visualized in notebook board in the application. *** Main process of the algorithm is shown in the notebook board. *** Here shows how rath use visual-insights to make a analytic pipeline.
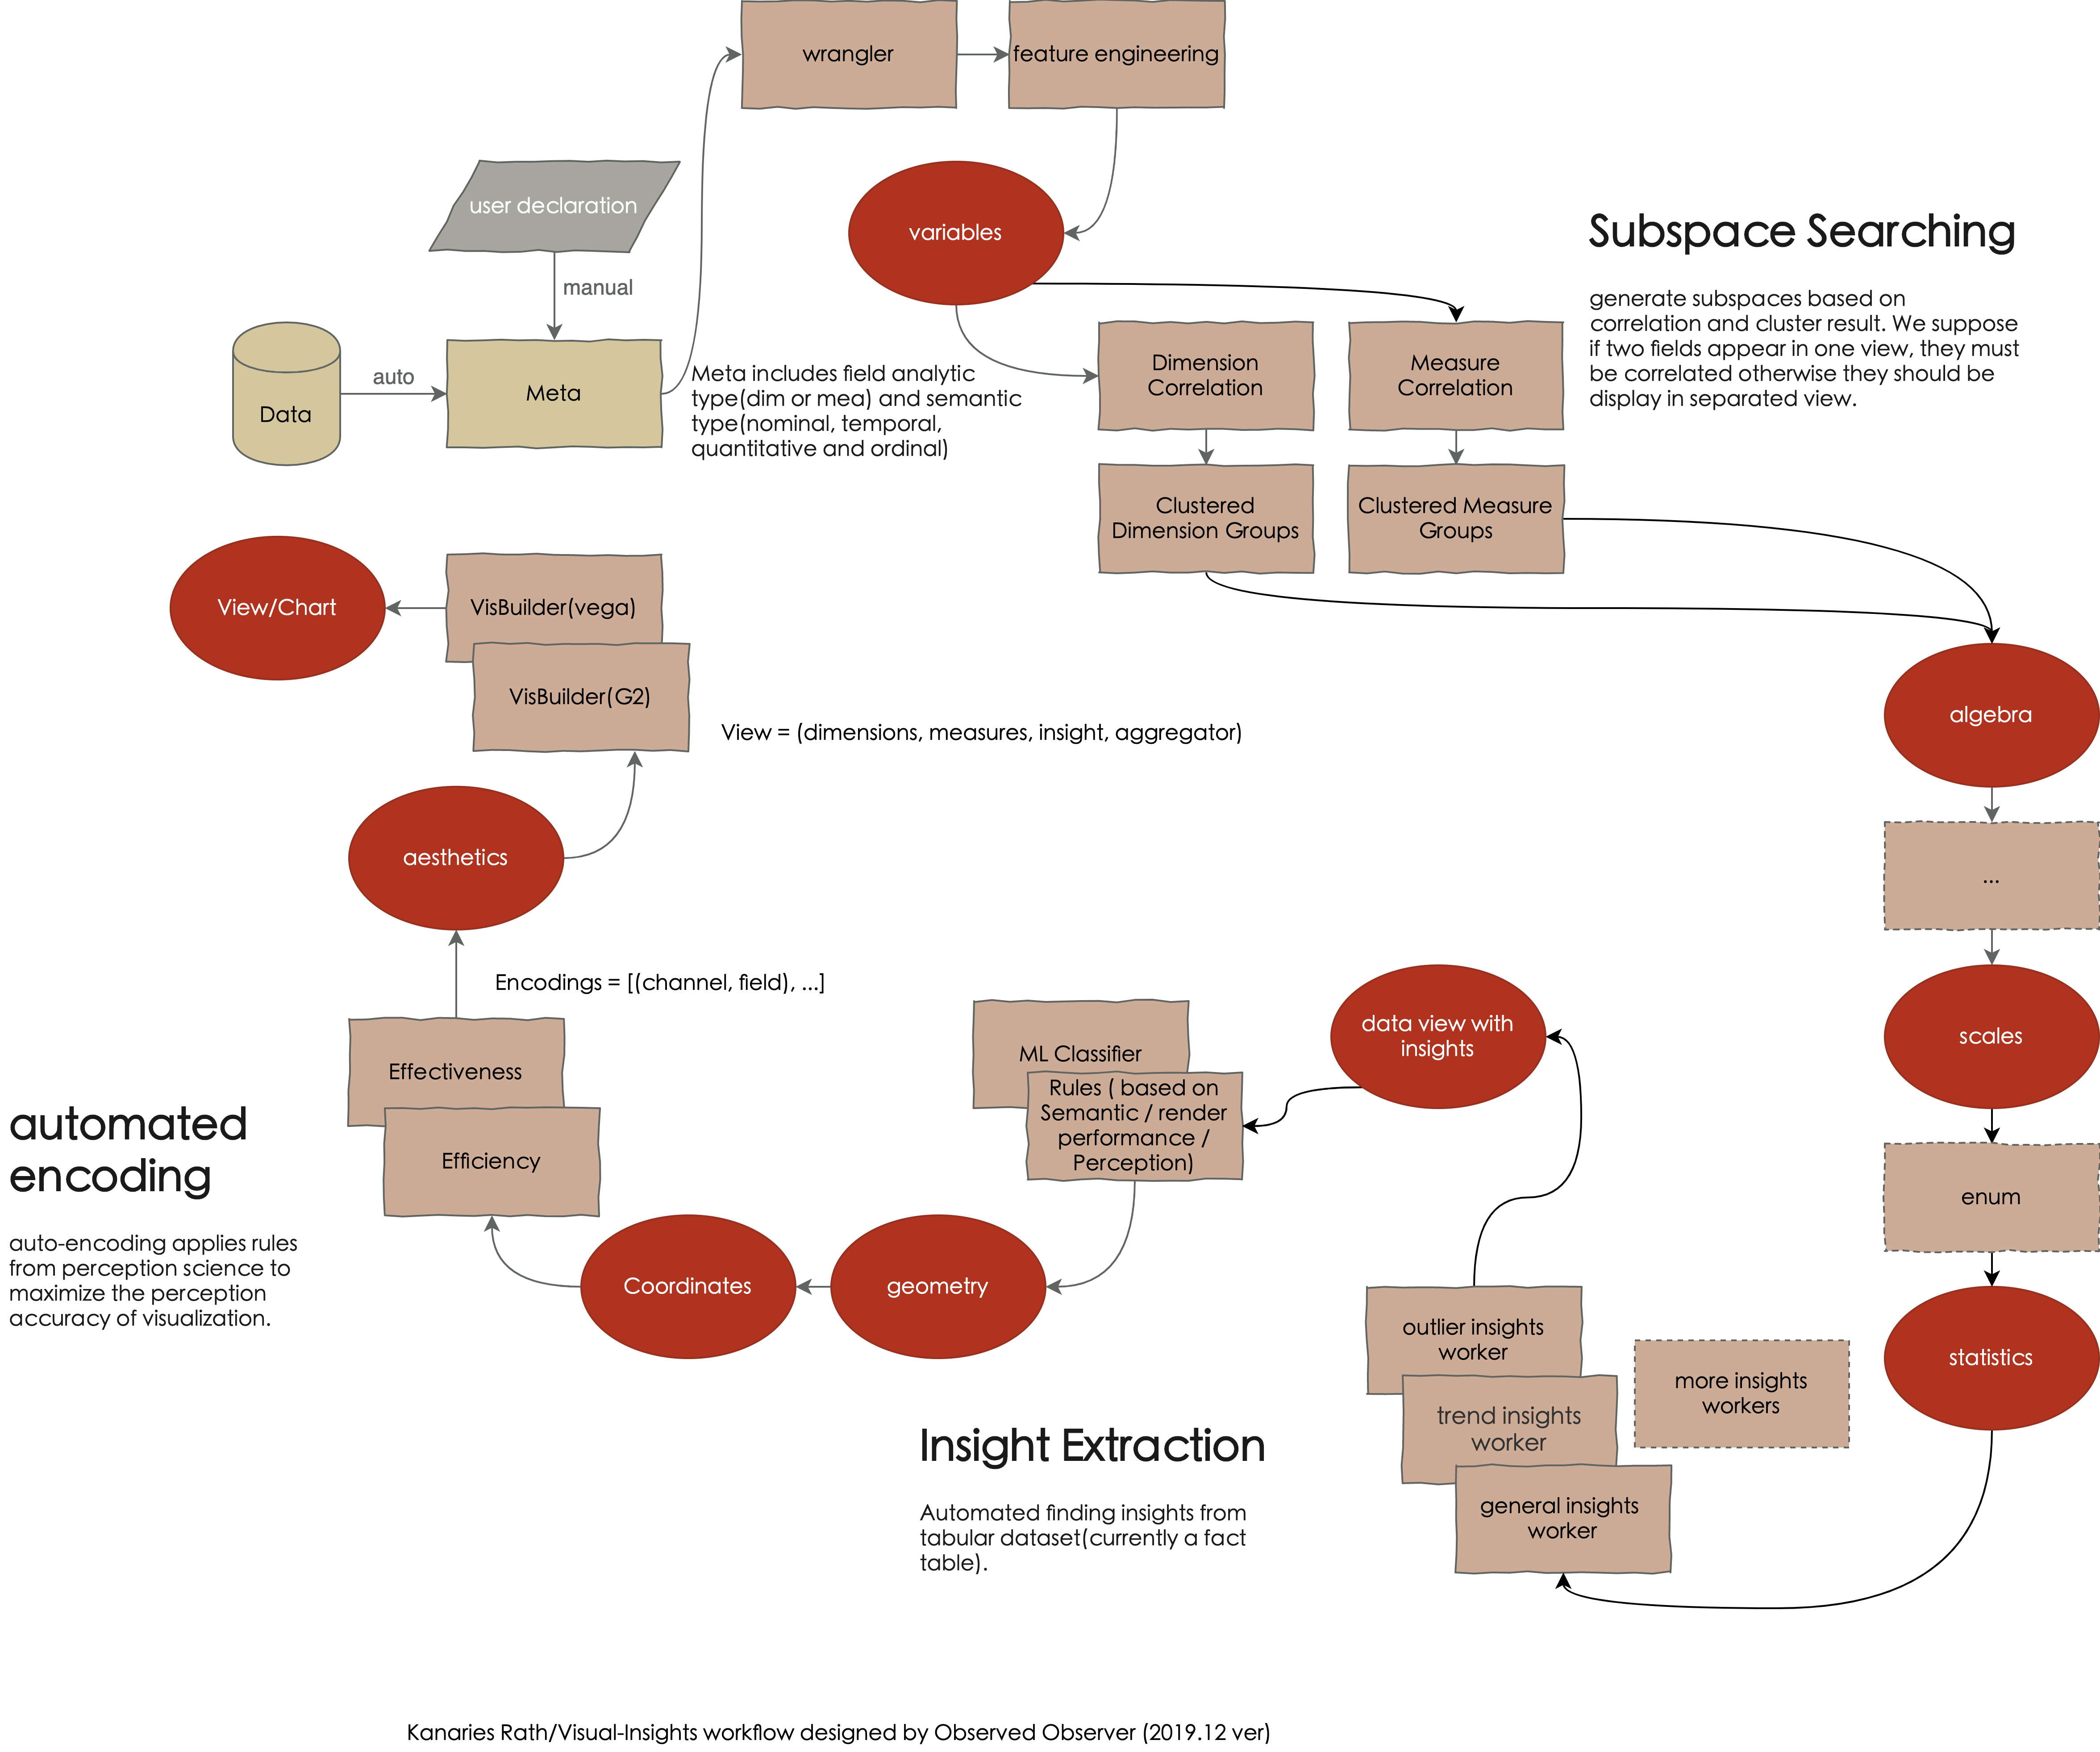
For the first step, rath analyze all the fields in the dataset independently. It gets the fields' distributions and calculate its entropy. Besides, it will define a semantic type (quantitative, ordinal, temporal, nominal) for each field. More details of the field will be displayed when hover your mouse on the fields.
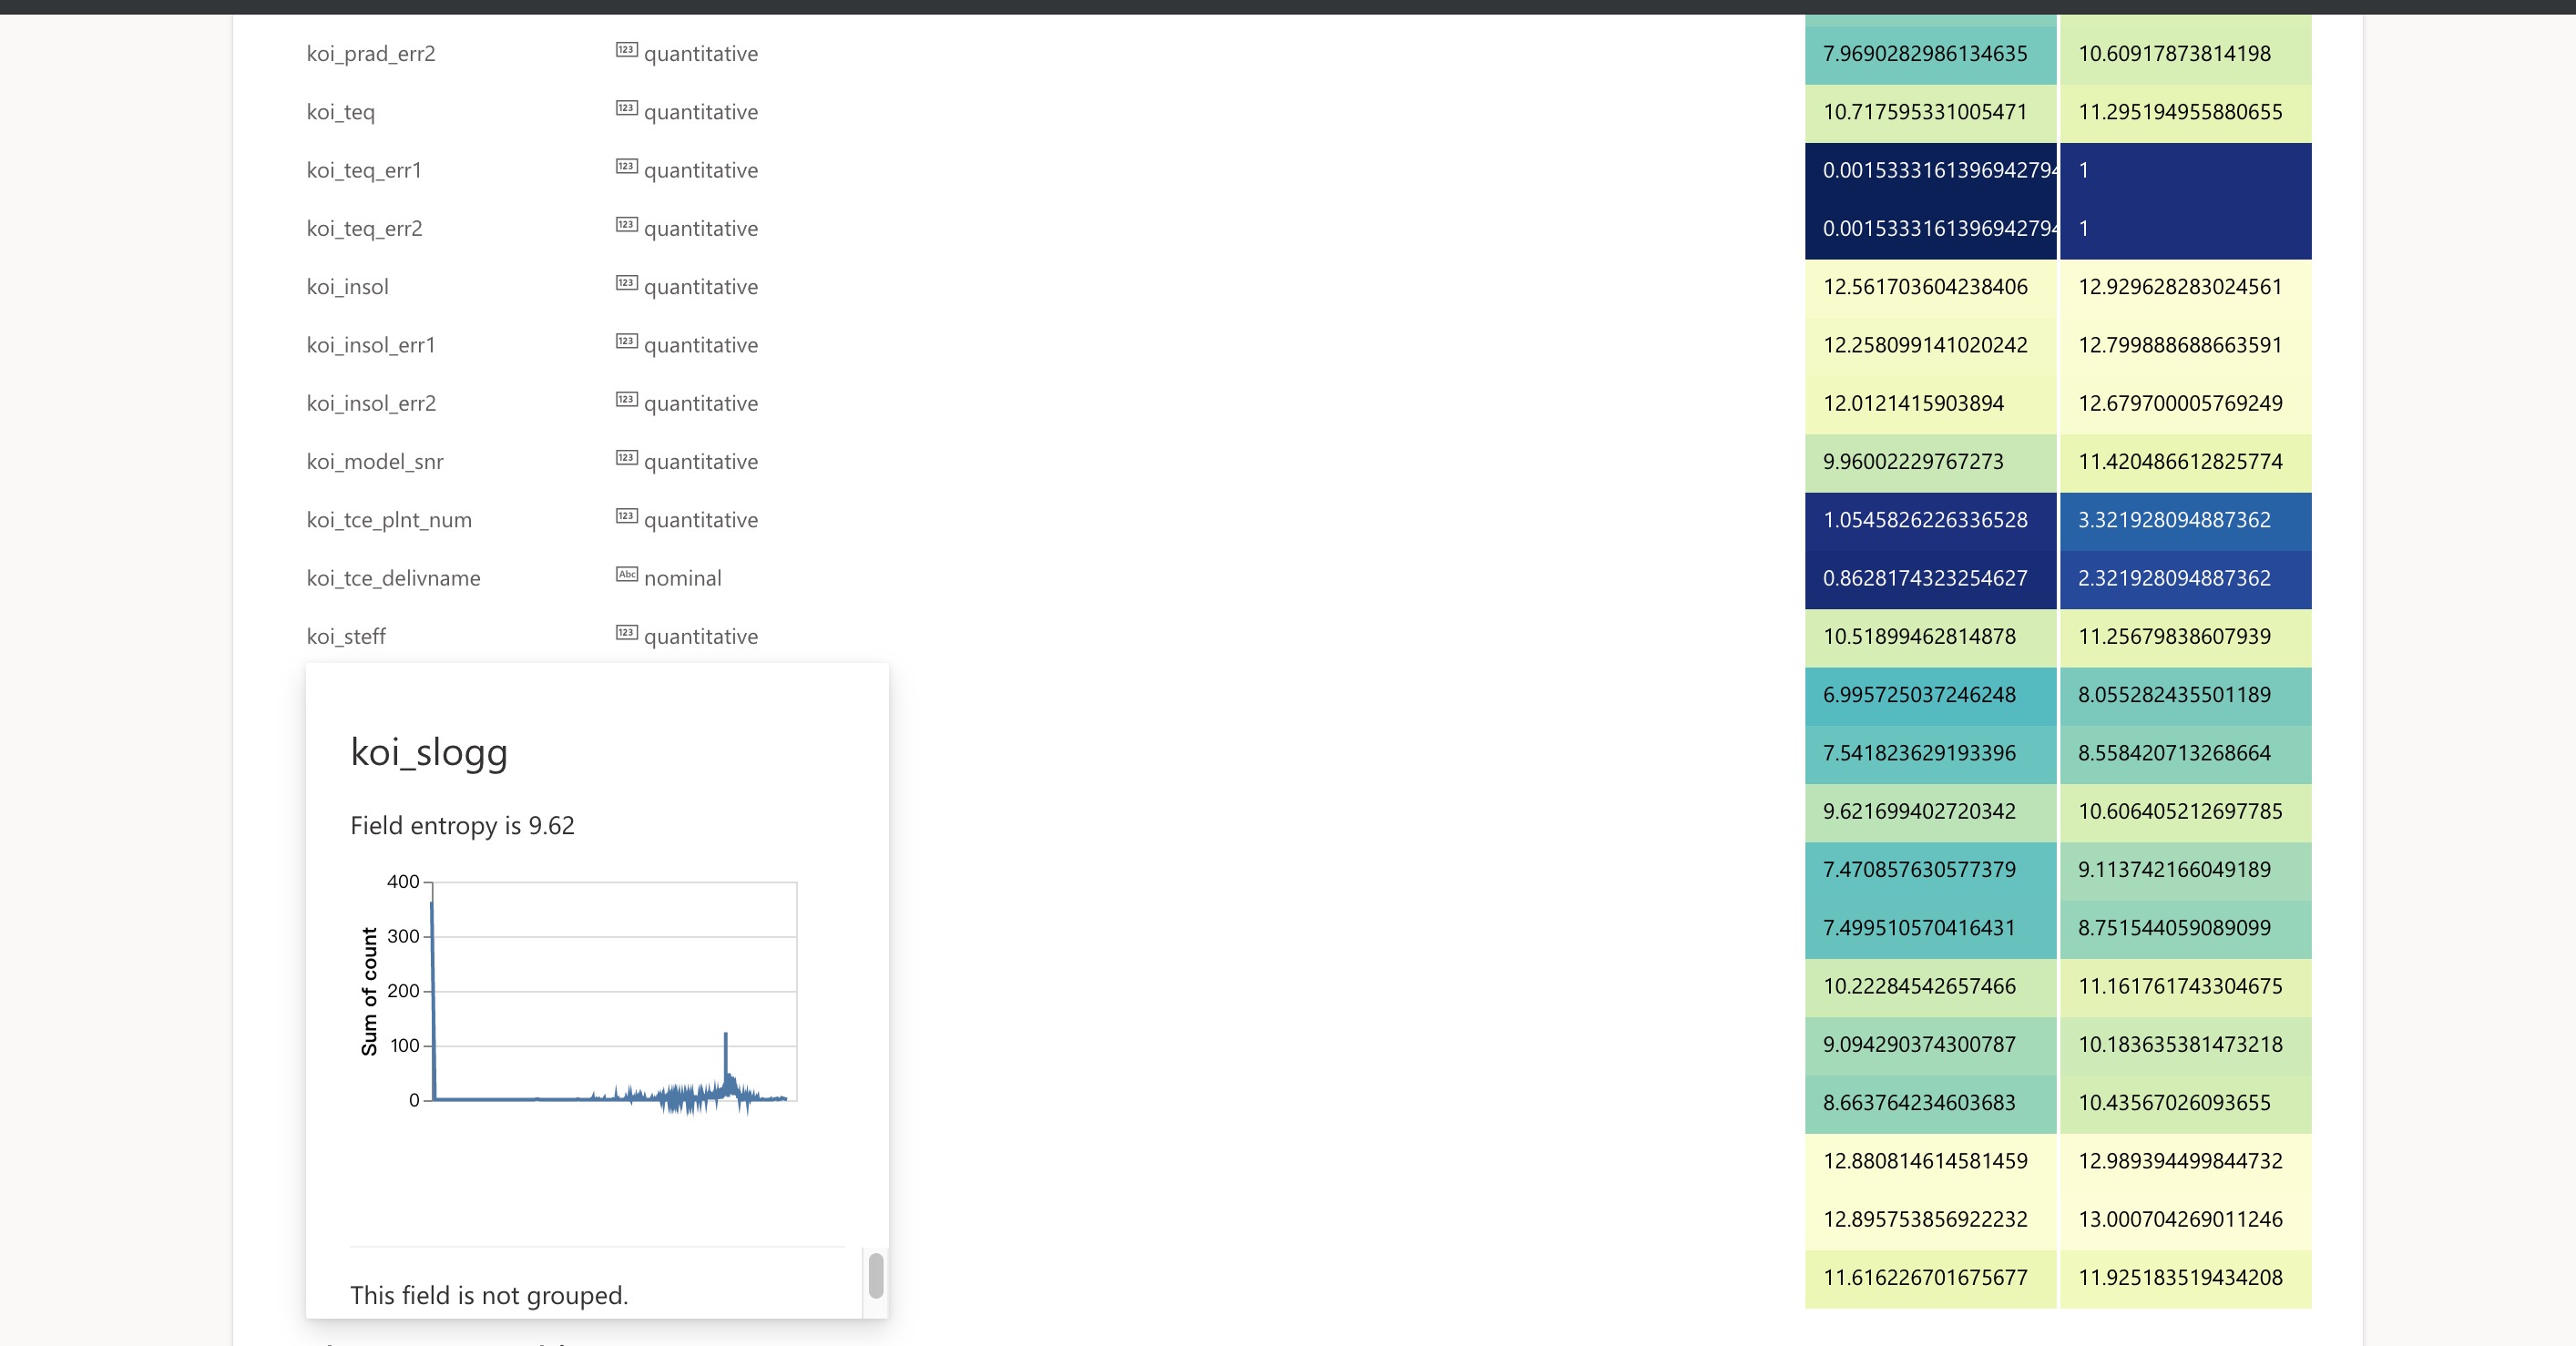
Then, it will find the fields with high entropy and try to reduce it by grouping the field (for example). Only dimensions participates this process.
In this step, visual insights search the combination of fields. Visual-Insights suppose that any two fields appears in a view should be correlated with each other otherwise they should be display in seperated view. Visual-Insight now use crammver'V and pearson' cc for different types of fields' correlation.

for example, the correlation of measures:

It helps you to cluster all the measures based on their correlation. It puts all the variables who are strongly related together to make a specific view (with specified dimenions).

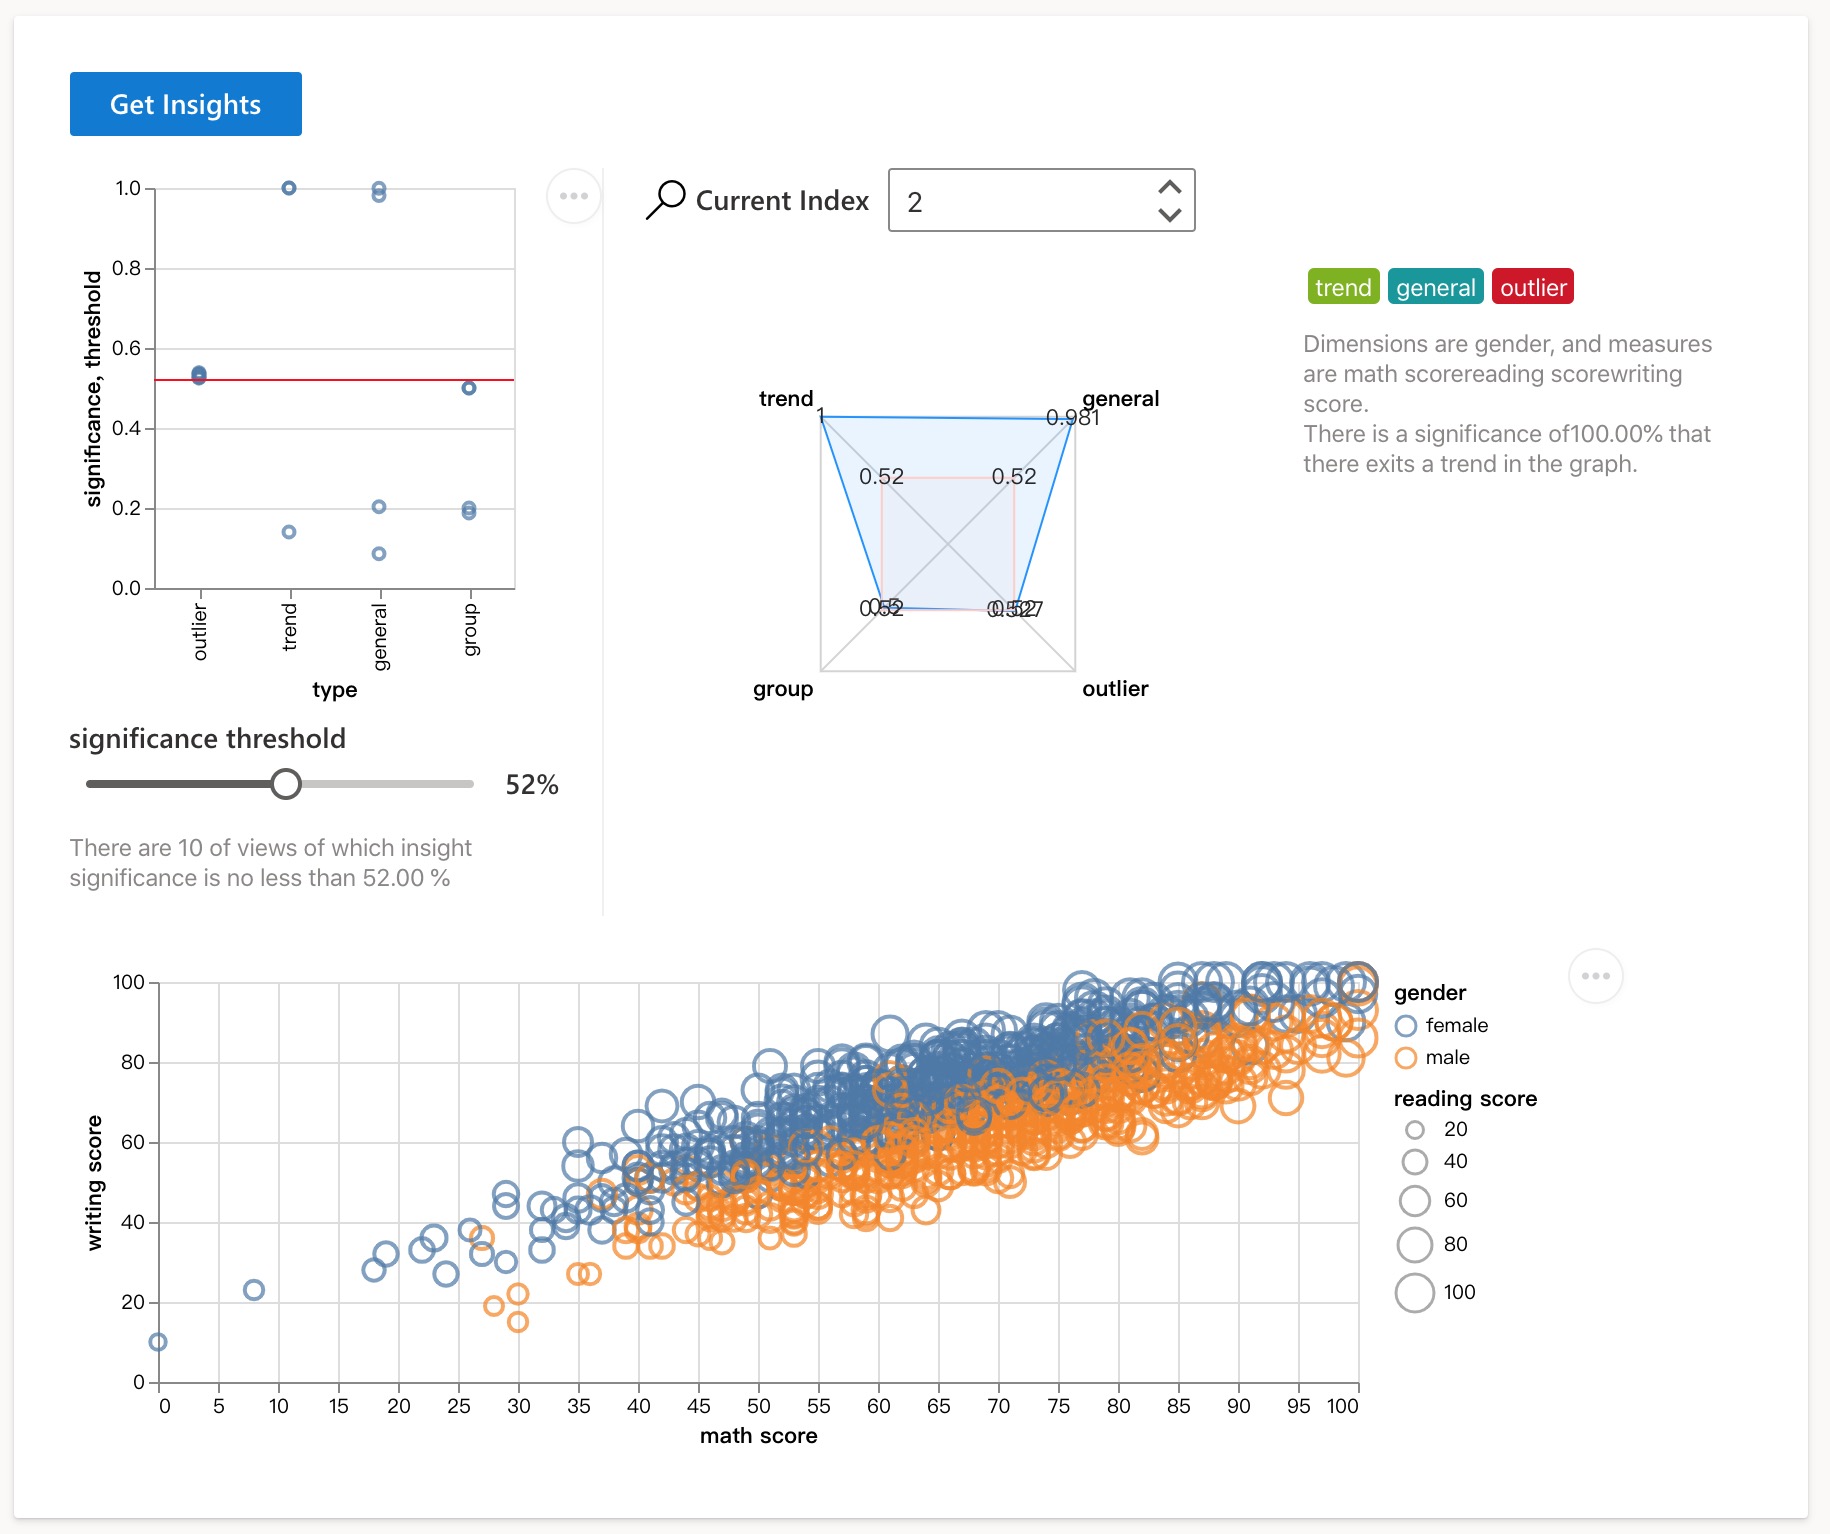
After we get many subspaces, we can check the insight significance of each space. Currently, visual-insights support trend, outlier, group(whether different groups of data behave differently for spefic measures)
specification
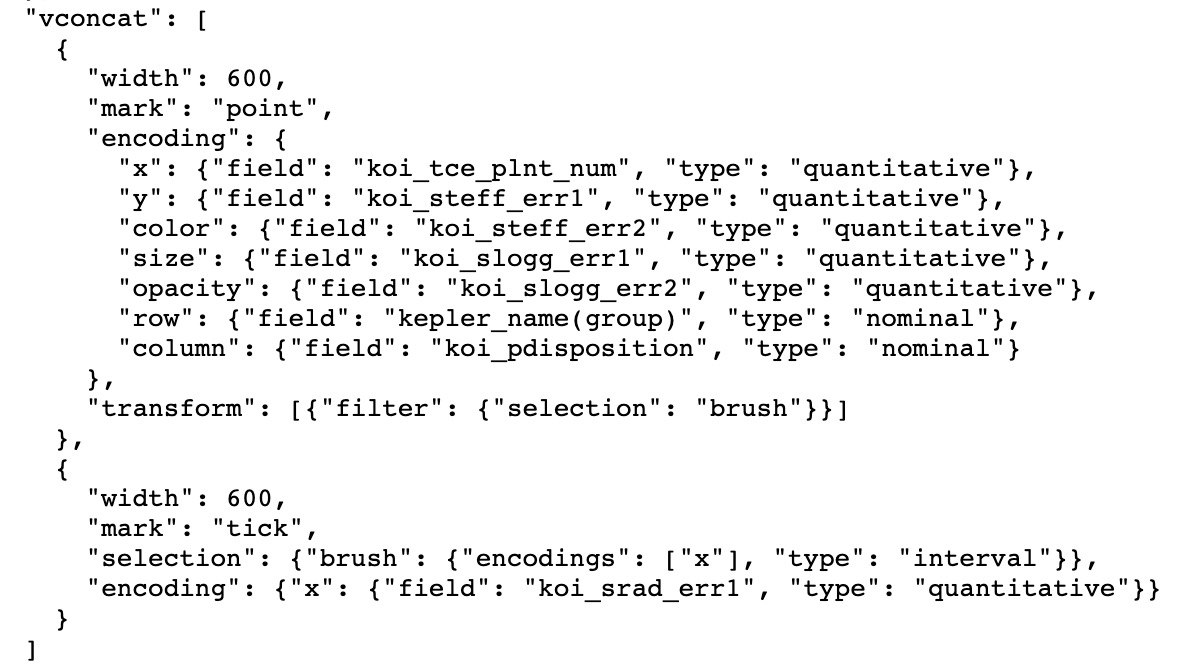
visualization.

- visual insight api: visual-insights
- doc for reuseable hooks: todos
Rath is insipired by several excellent works below:
- Wongsuphasawat, Kanit, et al. "Voyager 2: Augmenting visual analysis with partial view specifications." Proceedings of the 2017 CHI Conference on Human Factors in Computing Systems. ACM, 2017.
- B. Tang et al, "Extracting top-K insights from multi-dimensional data," in 2017, . DOI: 10.1145/3035918.3035922.
- A. Satyanarayan, K. Wongsuphasawat and J. Heer, "Declarative interaction design for data visualization," in 2014, . DOI: 10.1145/2642918.2647360.
- Cleveland, W., & McGill, R. (1984). Graphical Perception: Theory, Experimentation, and Application to the Development of Graphical Methods. Journal of the American Statistical Association, 79(387), 531-554. doi:10.2307/2288400
Rath is original from Mome Raths in Alice's Adventures in Wonderland.
The word Rath is used in SAO Alicization as name of org. developing Soul Translator (STL) and Under World, which creates A.L.I.C.E.