The nihexporter package provides a minimal set of data from NIH EXPORTER, which contains information on NIH biomedical research funding from 1985-2014 (and continues monthly in a given fiscal year).
Information about specific columns in the tables is here.
The package contains the following tables:
-
projects: provides data on funded projects by NIH. -
project_pis: links project numbers (project.num) to PI ID (pi.id), which can used in NIH REPORTER searches -
project_orgs: links DUNS numbers (org.duns) fromprojectstable to information on specific organizations -
publinks: links Pubmed IDs (pmid) to project numbers (project.num) -
patents: links project IDs (project.num) topatent.id -
project_io: pre-computedn.pubs,n.patentsandproject.costfor eachproject.num
There are also a few helper variables that make exploratory analysis a bit easier:
nih.institutes: 27 NIH institutes in two-letter format
There is a lot of data in NIH EXPORTER, so this package aims to provide a minimal set of data without being too unwieldy. There are download and import scripts in the data-raw/ directory in the package.
Because total.cost is only available from fiscal year 2000 and onward, only data from those years is provided in the projects table. The publinks table goes back to 1985.
Install the nihexporter package from github with:
devtools::install_github("jayhesselberth/nihexporter")
List the all-time most expensive grants from each institute:
expensive_projects <- projects %>%
  select(project.num, institute) %>%
  group_by(project.num, institute) %>%
  left_join(project_io) %>%
  ungroup() %>%
  group_by(institute) %>%
  arrange(desc(project.cost)) %>%
  slice(1:1) %>%
  ungroup() %>%
  arrange(desc(project.cost)) %>%
  mutate(cost.in.billions = project.cost / 1e9)
#> Joining by: "project.num"
#> Warning in left_join_impl(x, y, by$x, by$y): joining character vector and
#> factor, coercing into character vector

head(expensive_projects)
#> Source: local data frame [6 x 6]
#>
#>   project.num institute n.pubs n.patents project.cost cost.in.billions
#> 1 ZIHLM200888        LM    126         1   1544981304        1.5449813
#> 2 ZIFBC000001        CA      1         1    652060692        0.6520607
#> 3 U54HG003067        HG    139         1    527942706        0.5279427
#> 4 ZIFAI000001        AI      1         1    389496063        0.3894961
#> 5 ZIIMD000005        MD      1         1    373377914        0.3733779
#> 6 U01AG009740        AG    432         1    219008592        0.2190086
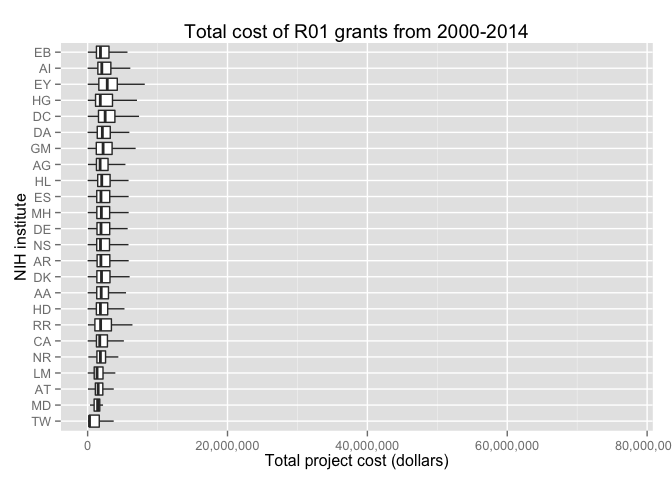
Let's look at the amounts spent on R01 grants at each NIH institute. Note this filters for NIH institutes.
project_costs <- projects %>%
  filter(institute %in% nih.institutes & activity == 'R01') %>%
  left_join(project_io) %>%
  select(institute, project.cost)

ggplot(project_costs, aes(reorder(institute, project.cost, mean, order=TRUE), project.cost)) +
  geom_boxplot(outlier.shape = NA) +
  coord_flip() +
  scale_y_continuous(labels = comma) +
  ylab('Total project cost (dollars)') +
  xlab('NIH institute') +
ggtitle('Total cost of R01 grants from 2000-2014')See the vignette or the vignette source for more examples.

