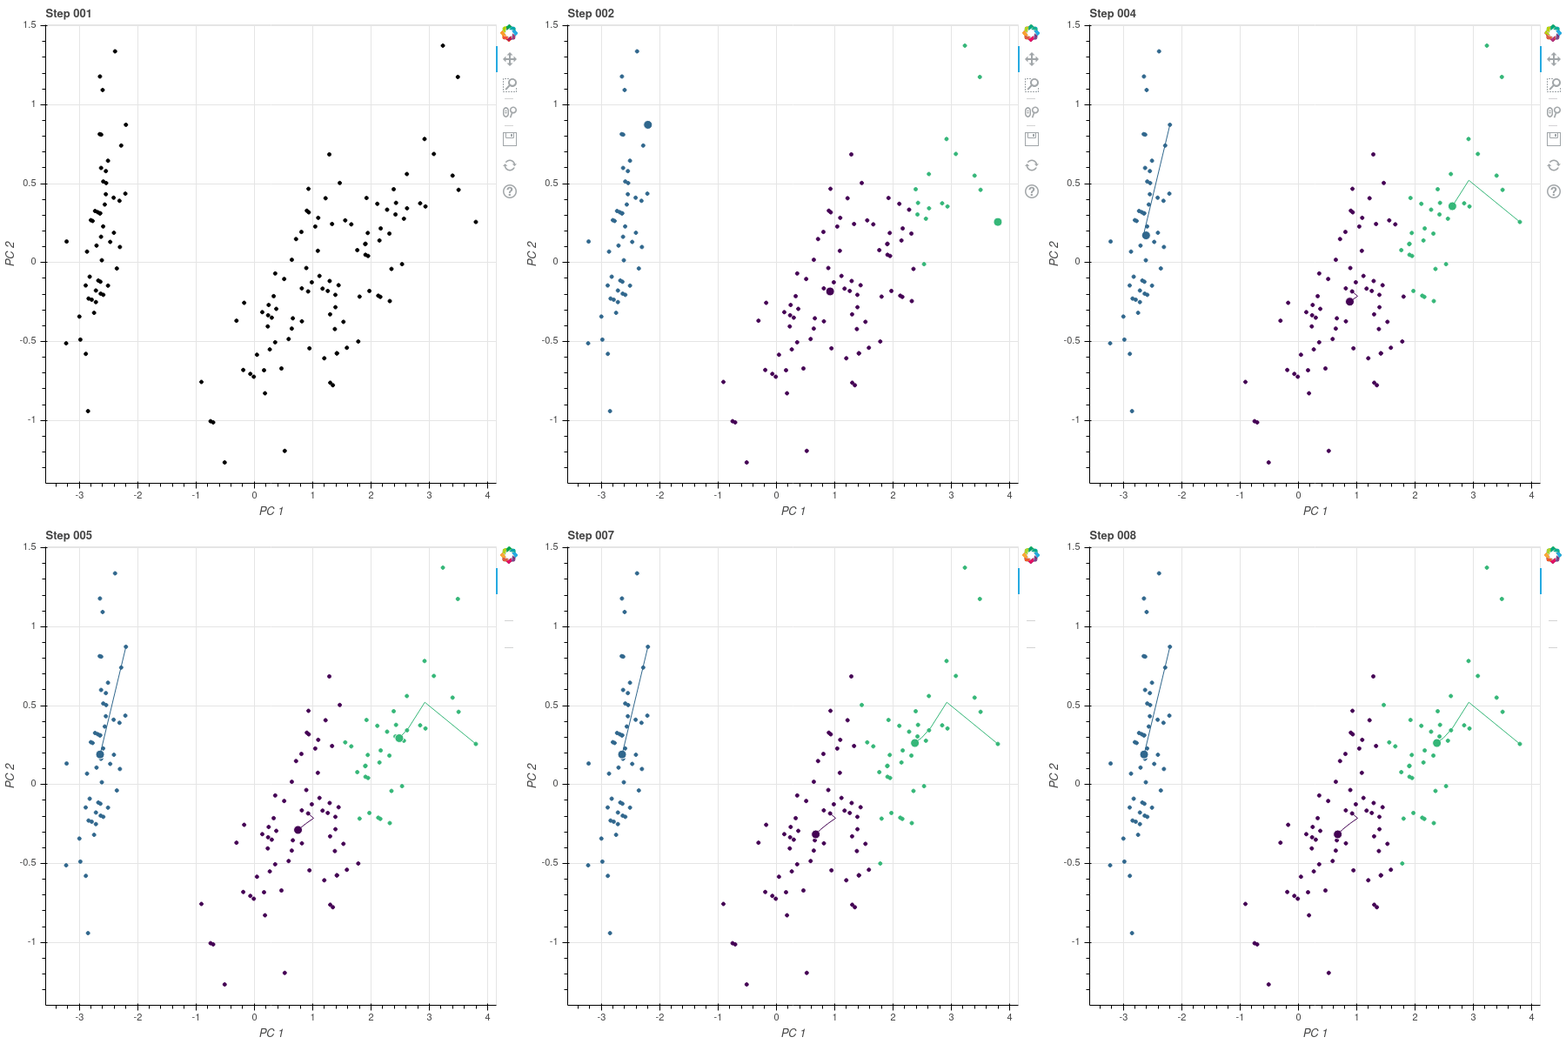
k-means plotter
A function that visualises k means clustering in a gif image.
Usage
from kmeans_plotter import k_means_gif
k_means_gif(<k>, <data with n rows and m features>, <file_of_the_gif.gif>)
See the example scripts.
Dependencies
For the function to work you need to have the following python libraries installed:
- Bokeh: https://bokeh.org/
- imageio: https://imageio.readthedocs.io/en/stable/
- numpy: https://numpy.org/
- sklearn: https://scikit-learn.org/
- tqdm: https://tqdm.github.io/
I run python 3.7.3. So it will run with any version higher than this. For lower versions I don't know.
Arguments
The function takes the following arguments:
- k: the k for the k means algorithm.
- data: any m,n matrix
- filename: the filename where the gif will be stored.
- add_trace=True: whether you want to add a trace indicating the centroids routes.
- max_it=100: The maximum number of iterations the k-means algorithm will take.
- max_difference = 0.001: the max difference between the previous centroids and the current. Determines when the k-means have "converged".
- seed=42: a random seed used at the initialization of the centroids.
The k-means algorithm will stop either when the max_it has been reached or when the difference between the current and previous centroids is smaller than max_differens. Whichever comes first.
NOTE
Some implementation choices (that might not be ideal):
- This is a quick implementation of k-means. It works fine, but it is not optimized and might not scale well.
- The centroids are initialized by picking k random data points from the data set.
- The distance between the current and previous centroids is calculated by calculating the euclidean distances between the centroids and summing those distances.
- For the visualisation, the dimensionality of the data is reduced to 2 with PCA.
If you want to do actual k-means: use (for example) the implementation of sklearn or make your own.
TODO
Things I want to improve if I find time and motivation. (You can also send a pull request)
- Add documentation in the code.
- Optimize for speed.
- Use a proper way to calculate the distance between centroids.
- Implement in matplotlib so it also works when bokeh is not installed.
- Use a more clear color scheme.
- Add parameters for the speed of the gif.
Feedback
Any feedback is welcome.
Add a pull request, raise an issue or contact me in person. Find me on:
