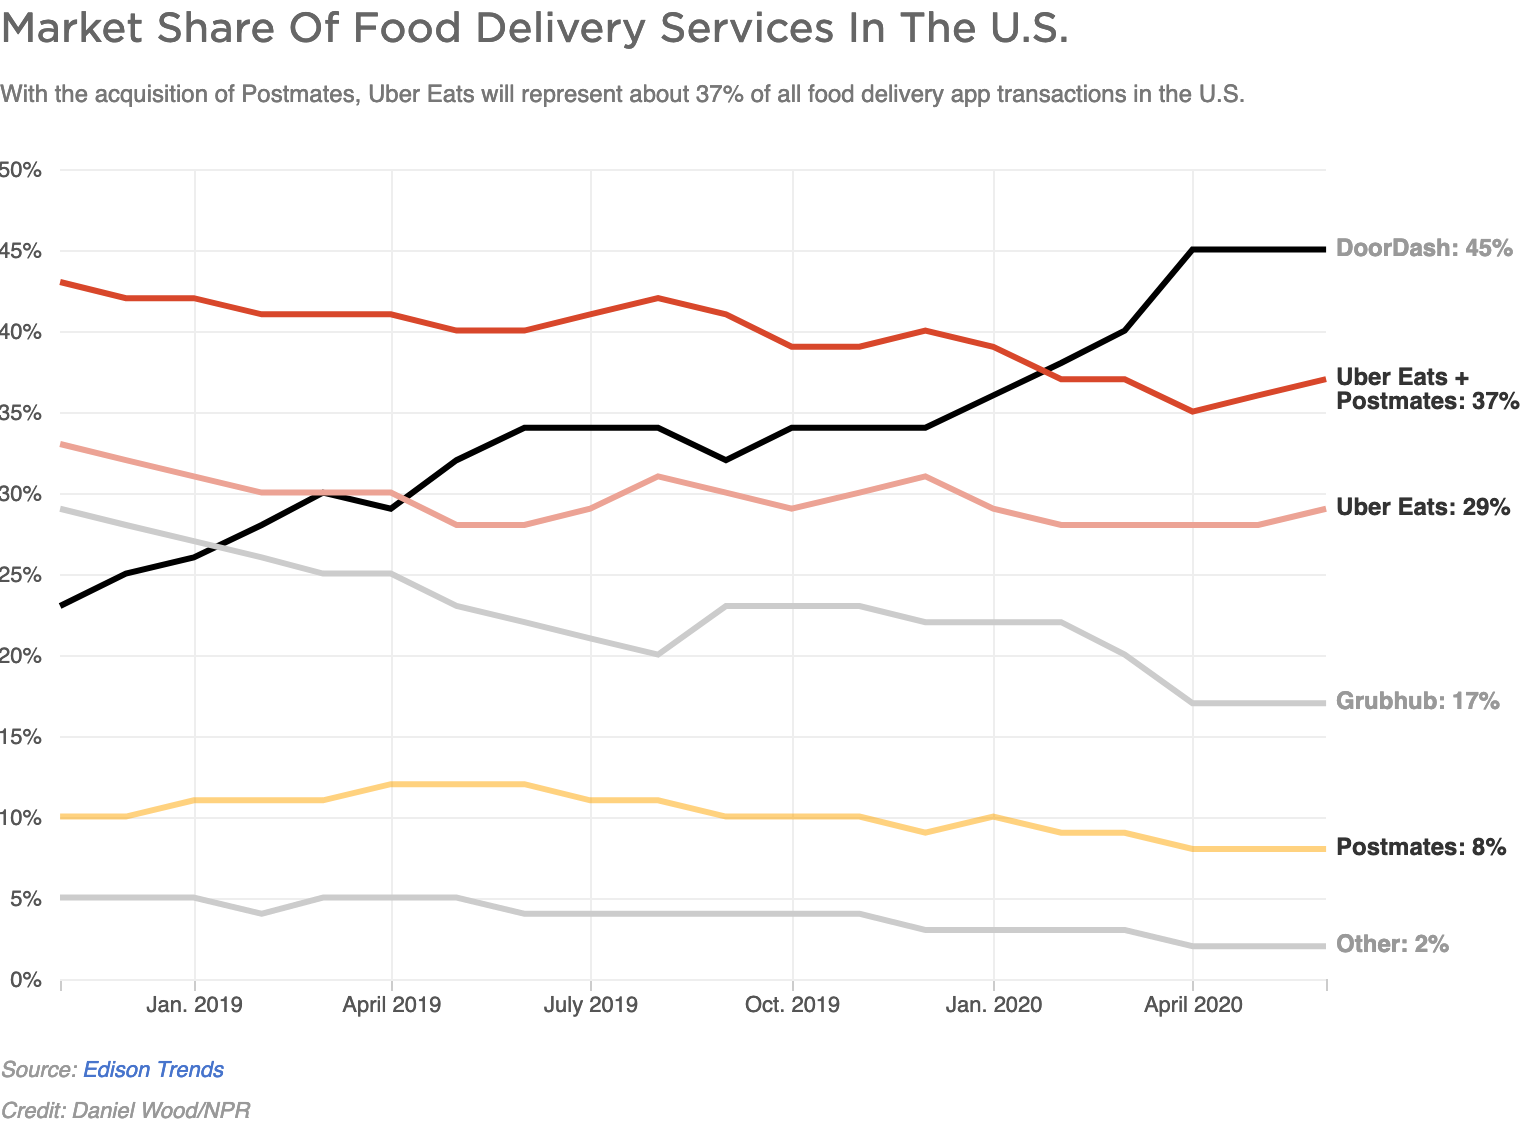
Competition in the food delivery market is fierce, particularly with the impact of pandemic-weary consumers and hindered demand for dine-in restaurants. As of 2020, DoorDash has the largest market share of 45%, followed closely by the combined shares of Uber Eats and Postmates at 37% (following a July 2020 acquisition).
The current market provides an opportunity to innovate by making improvements in UI/UX of both food delivery websites and applications.
A study by Nielsen Norman Group emphasizes that despite an increase in internet speeds, page load times have not meaningfully improved over time. This is important because "the effects of slow-loading web pages on site abandonment and conversion has been proven time and again" as supported by the following studies:
- Google found 53% of mobile visits ended if a page took longer than 3 seconds to load.
- Mozilla experiment which found that reducing the page load time by 2 seconds led to 15% higher conversion.
- Akamai aggregated data from 17 retailers (7 billion pageviews) and found that conversion rates were highest for pages that loaded in less than 2 seconds; longer load times correlated with 50% drops in conversion rates and increased bounce rates, especially for mobile visitors.
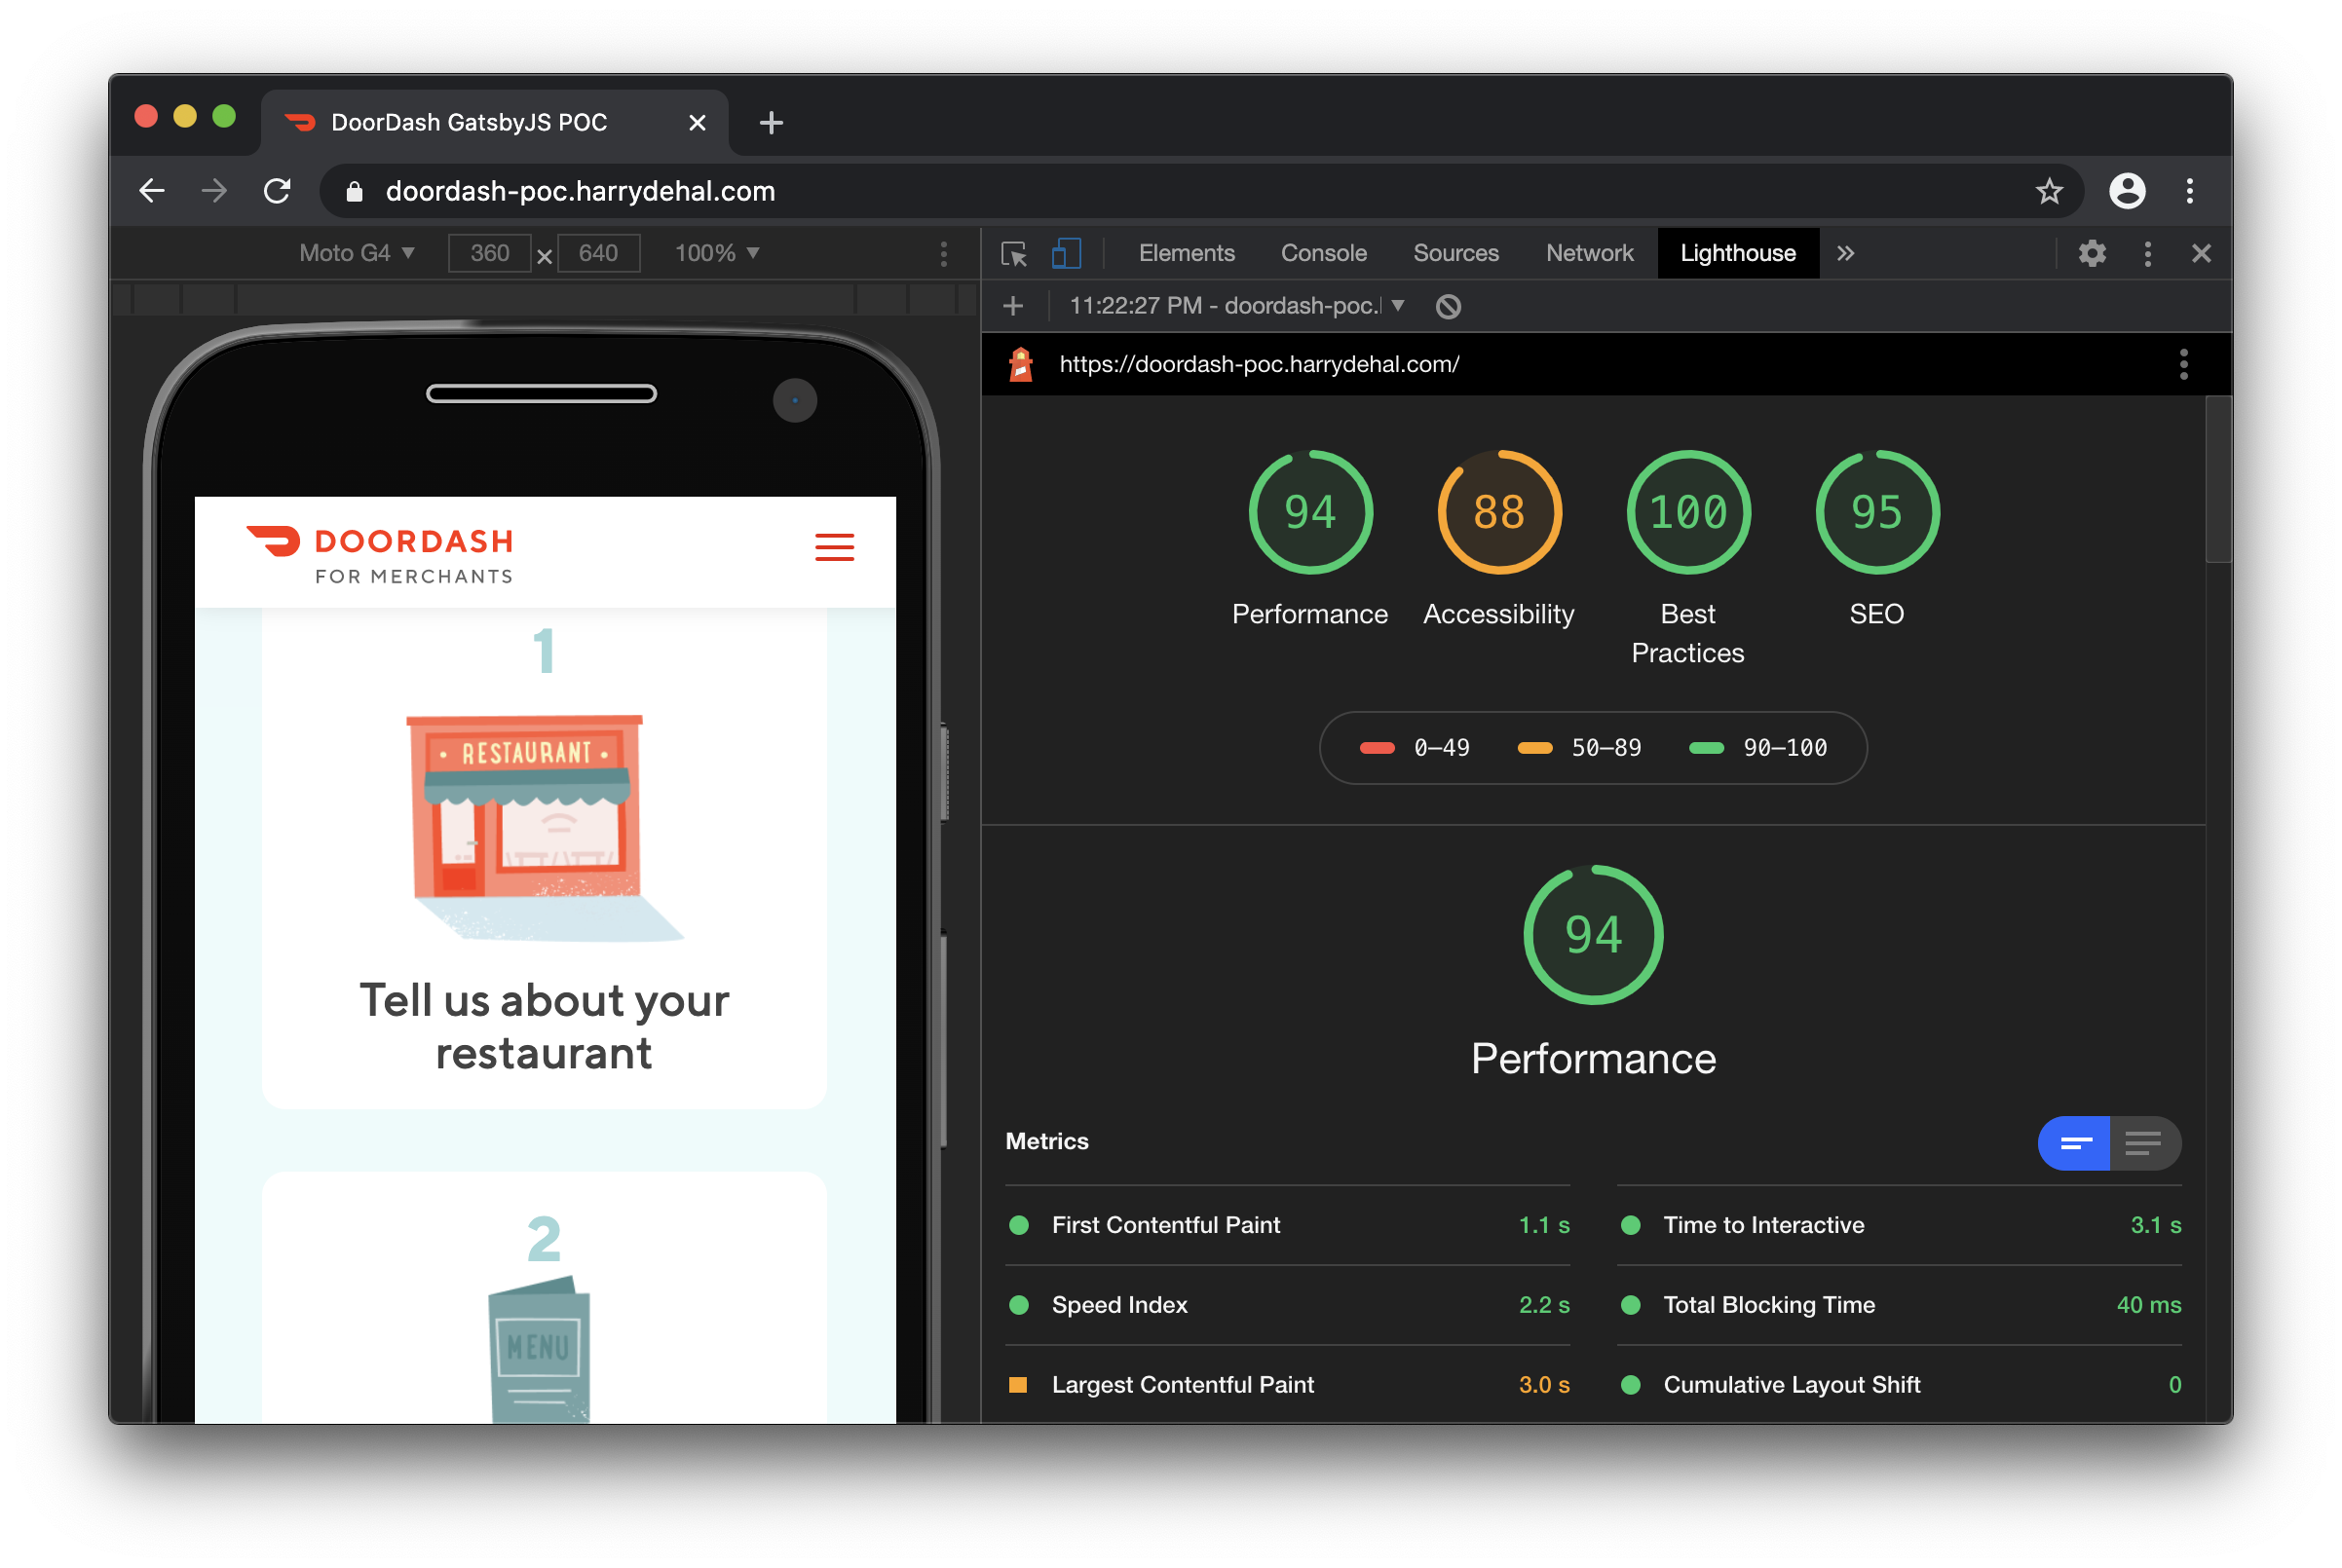
This experiment was conducted using the B2B or merchant websites from a handful of popular food delivery companies. I chose the website for the market leader and converted the existing DoorDash B2B website to a new CMS and tech stack, with the goal of measuring hypothetical improvements against its competitors.
🔗 View the DoorDash POC here: https://doordash-poc.harrydehal.com
| Company | URL | Stack or CMS |
|---|---|---|
| DoorDash POC | https://doordash-poc.harrydehal.com | Netlify, React, GatsbyJS |
| DoorDash | https://get.doordash.com | HubSpot COS |
| Grubhub | https://get.grubhub.com | WordPress |
| Postmates | https://postmates.com/partner | React |
| Uber Eats | https://www.ubereats.com/restaurant | Enyo |
| Zomato | https://www.zomato.com/business | React |
Google Lighthouse is an open-source, automated tool built into Chrome for measuring and improving the quality of web pages. Lighthouse has audits for:
- Performance (incl. speed)
- Accessibility
- Best Practices
- SEO
Firefox Developer Tools were used to measure transferred data size (in KB or MB) and load event (in milliseconds or seconds).
| Company | Performance | Accessibility | Best Practices | SEO | Transferred | Load Event |
|---|---|---|---|---|---|---|
| DoorDash POC | 94 ✅ | 88 ✅ | 100 ✅ | 95 ✅ | 906 KB | 0.454 ms ✅ |
| DoorDash | 29 | 72 | 77 | 80 | 2.23 MB | 4.354 s |
| Grubhub | 30 | 70 | 92 | 85 | 2.84 MB | 2.742 s |
| Postmates | 29 | 70 | 92 | 85 | 2.33 MB | 1.446 s |
| Uber Eats | 17 | 68 | 85 | 92 | 1.48 MB | 1.580 s |
| Zomato | 53 | 56 | 77 | 82 | 628 KB ✅ | 1.191 s |
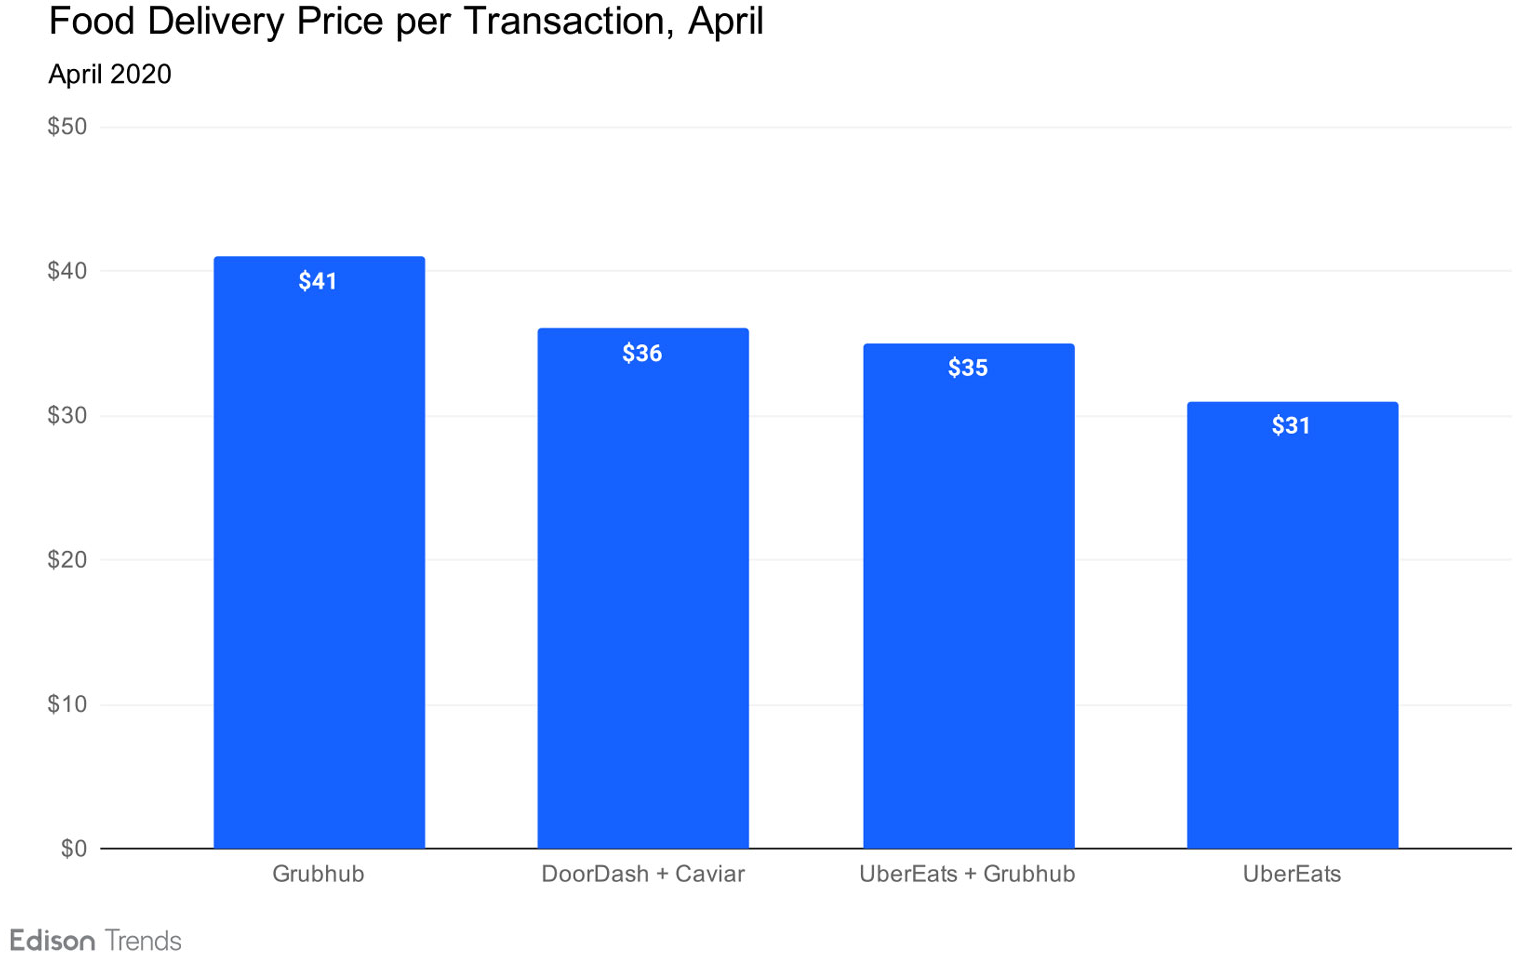
On the consumer side DoorDash customers spent $36 per transaction, while Grubhub customers spent the highest average price per transaction at $41 and UberEats trailed at $31. While the respective app stores (Apple and Google Play) and the delivery apps themselves are important launchpads for consumer purchases, the B2B or merchant websites are ultimately the last-mile or gatekeepers for new restaurant sign-ups.
With DoorDash having a market share of 45% and revenue upwards of $900m per year, reducing the page load time by merely 2 seconds could lead to a higher merchant conversion rate optimization (CRO) of 15% (per Mozilla) up to 50%+ (per Akamai and Google).
In conclusion, improving the B2B websites with an emphasis on performance, accessibility (a11y), internationalization (i18n), SEO, and overall UI/UX best practices can help capture tens of millions of dollars in revenue by optimizing merchant conversion rates (CRO), which are extremely vulnerable to hungry (or hangry) customers impacted by speed or other accessibility issues. Ultimately, with food delivery, every second counts for hungry customers.
Node.js v12.14.1
- Yarn v1.21.1
- Gatsby v2.24.37
macOS v10.15.3
- Firefox 79.0 (64-bit)
- Dev Tools (Network)
- iPhone 6/7/8 iOS (Emulation)
- Chrome 84.0.4147.105 (Official 64-bit)
- Lighthouse
- https://www.nngroup.com/articles/the-need-for-speed
- https://www.npr.org/sections/coronavirus-live-updates/2020/07/06/887961123/uber-gobbles-up-postmates-in-2-65-billion-bet-on-food-delivery
- https://developers.google.com/web/tools/lighthouse
- https://trends.edison.tech/research/on-demand-food-delivery-sales-2020.html
- https://www.crunchbase.com/organization/doordash/company_financials
Case study conducted under fair use and all content © DoorDash.