轻便式Redis Monitor面向研发人员图形可视化监控工具,借鉴了LEPUS(天兔)监控平台以及redis-cli info命令输出的监控指标项,去掉了一些不必要看不懂的监控项,目前采集了数据库连接数、QPS、内存使用率统计和同步复制延迟时长,以及列出当前所有慢查询命令。
Redis Monitor可以监控单机模式,哨兵模式,集群模式,并且录入一个主库或者从库IP,自动发现主库或者从库IP信息,无需人工再次录入。
采用远程连接方式获取数据,所以无需要在Redis服务器端部署相关agent或计划任务,可实现微信和邮件报警。
注:监控环境为Redis 6.2以上版本。
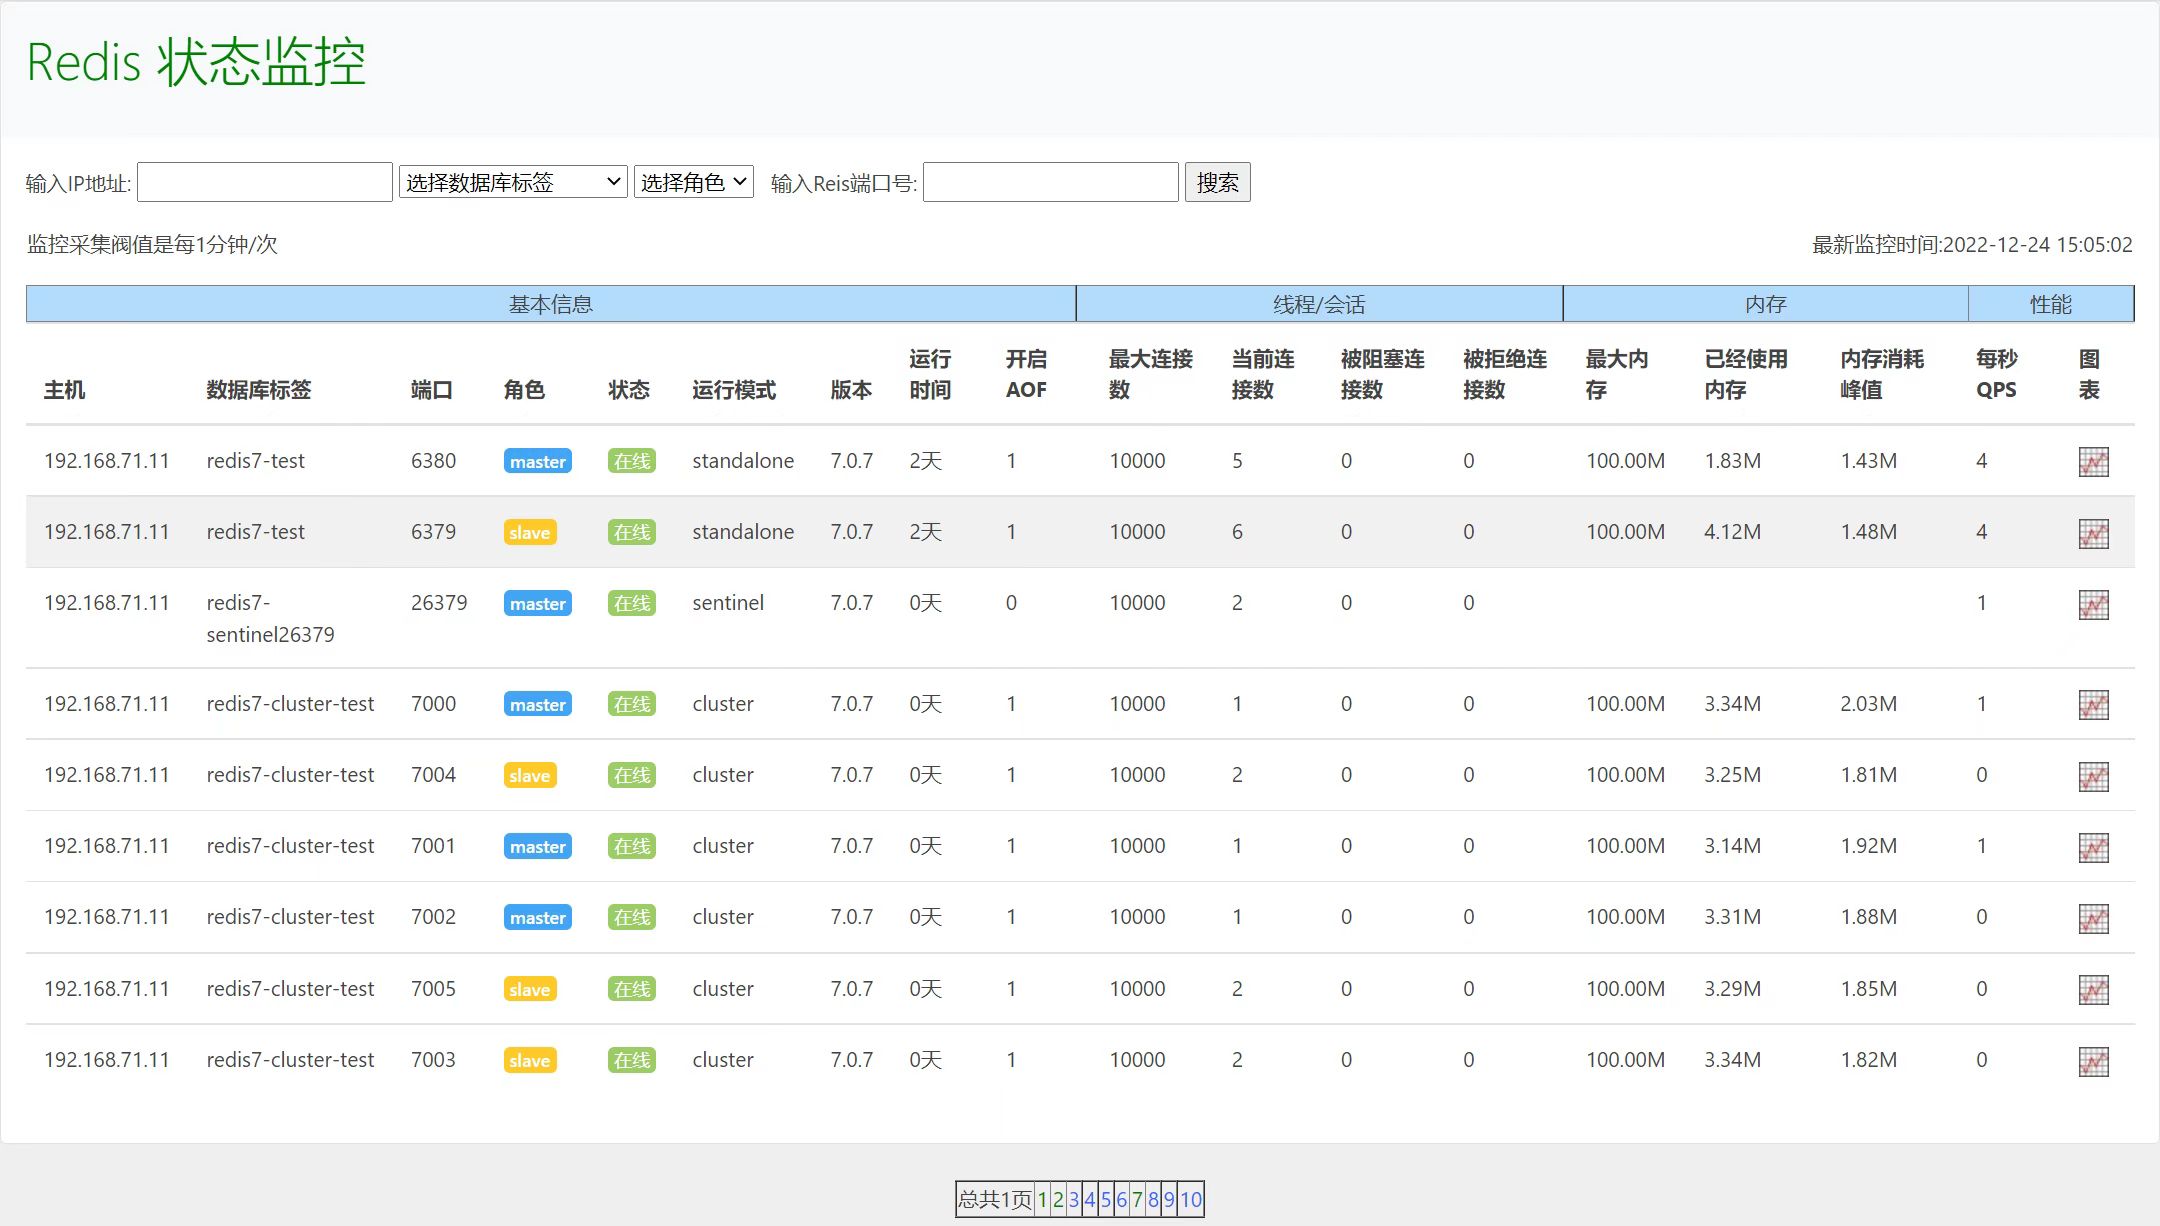
1)Redis状态监控
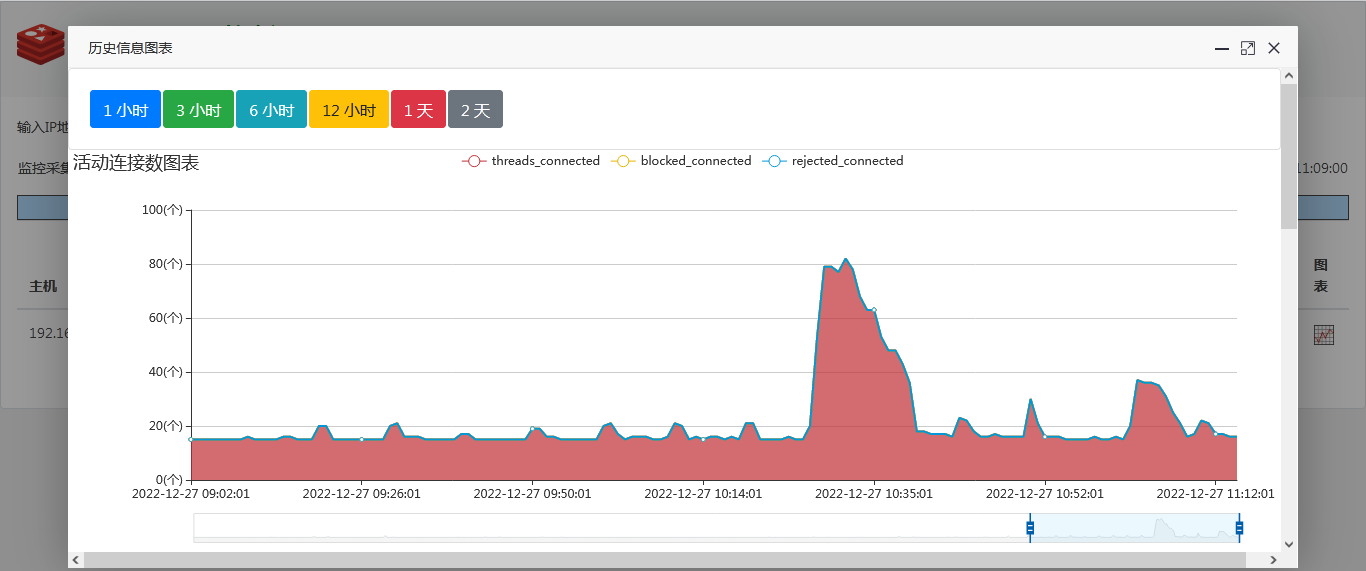
2)点击图表,可以查看历史曲线图
连接数
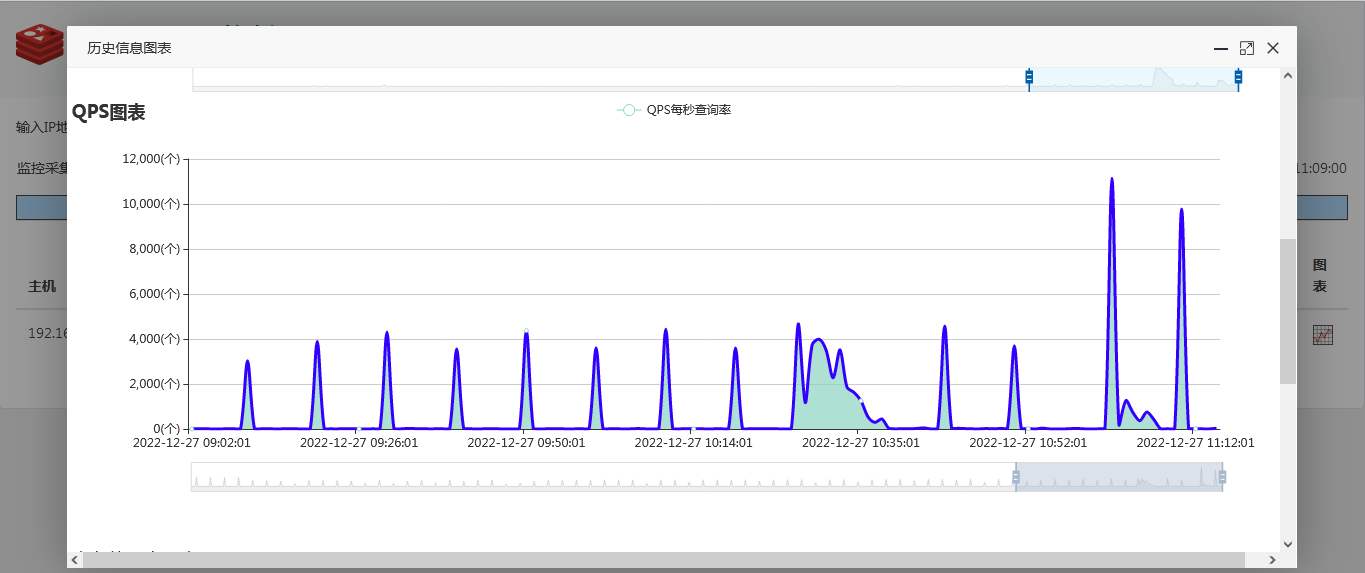
QPS每秒查询量
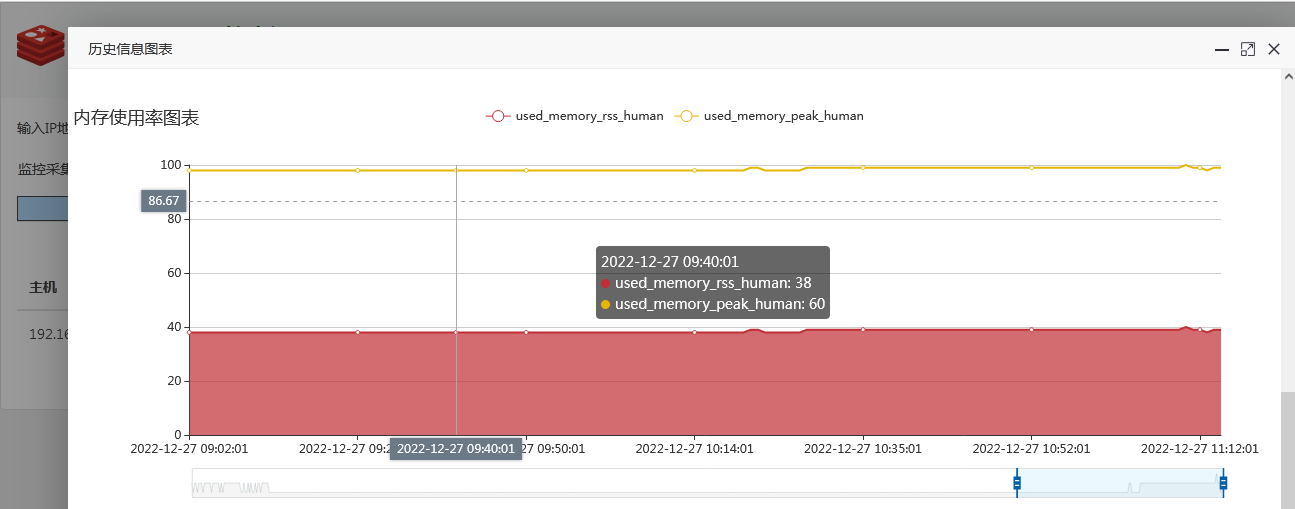
内存使用率
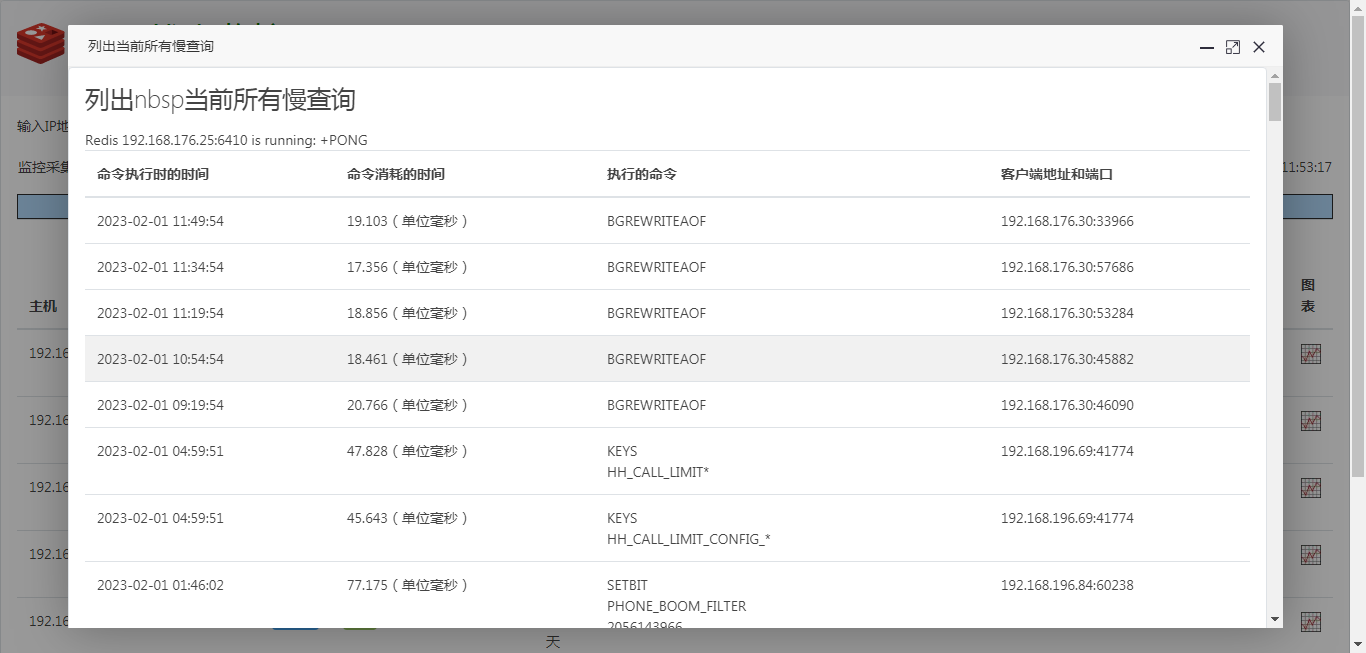
3)点击端口号,可以列出该实例下的所有慢日志命令
慢查询
1)php-redis驱动安装(Centos 7系统)
shell> yum install -y php-pear php-devel php httpd mysql php-mysqlnd php-redis
2)重启httpd服务
shell> systemctl restart httpd.service
3)redis需要授权连接密码
> config set requirepass yourPassword
把https://github.com/hcymysql/redis_monitor/archive/refs/heads/main.zip 安装包解压缩到 /var/www/html/目录下
cd /var/www/html/redis_monitor/

chmod 755 ./mail/sendEmail

chmod 755 ./weixin/wechat.py
(注:邮件和微信报警调用的第三方工具,所以这里要赋予可执行权限755)
cd /var/www/html/mongo_monitor/schema/

mysql -uroot -p123456 < redis_monitor_schema.sql
https://www.percona.com/blog/2018/04/30/a-look-at-myrocks-performance/
mysql> INSERT INTO `redis_status_info`(`id`,`host`,`tag`,`pwd`,`port`,`monitor`,
`send_mail`,`send_mail_to_list`,`send_weixin`,`send_weixin_to_list`,`alarm_threads_running`,
`threshold_alarm_threads_running`,`alarm_used_memory_status`,`threshold_warning_used_memory`)
VALUES (1,'192.168.176.27','Redis测试','hechunyang123456',6379,1,1,'hechunyang@126.com',1,'hechunyang',NULL,150,NULL,'200M');
注,以下字段可以按照需求变更:
ip字段含义:输入被监控Redis的IP地址
tag字段含义:输入被监控Redis的业务名字
pwd字段含义:输入被监控Redis的密码
port字段含义:输入被监控Redis的端口号
monitor字段含义:0为关闭监控(也不采集数据,直接跳过);1为开启监控(采集数据)
send_mail字段含义:0为关闭邮件报警;1为开启邮件报警
send_mail_to_list字段含义:邮件人列表
send_weixin字段含义:0为关闭微信报警;1为开启微信报警
send_weixin_to_list字段含义:微信公众号
threshold_alarm_threads_running字段含义:设置连接数阀值(单位个)
threshold_warning_used_memory字段含义:设置已用内存报警阀值(单位M)
vim /var/www/html/redis_monitor/conn.php

$con = mysqli_connect("127.0.0.1","admin","hechunyang","redis_monitor","3306") or die("数据库链接错误".mysqli_error());
改成你的Redis Monitor监控工具表结构(redis_monitor库)连接信息
cd /var/www/html/redis_monitor/mail/

vim mail.php

system("./mail/sendEmail -f chunyang_he@139.com -t '{$this->send_mail_to_list}' -s
smtp.139.com:25 -u '{$this->alarm_subject}' -o message-charset=utf8 -o message-content-type=html -m '报警信息:<br><font
color='#FF0000'>{$this->alarm_info}</font>' -xu chunyang_he@139.com -xp
'123456' -o tls=no");
改成你的发件人地址,账号密码,里面的变量不用修改。
cd /var/www/html/redis_monitor/weixin/

vim wechat.py
微信企业号设置移步
https://github.com/X-Mars/Zabbix-Alert-WeChat/blob/master/README.md 看此教程配置。
*/1 * * * * /usr/bin/php /var/www/html/redis_monitor/check_redis_status.php > /dev/null 2 >&1
vim redis_status_monitor.php

http-equiv="refresh" content="600"
默认页面每600秒自动刷新一次。
http://yourIP/redis_monitor/redis_status_monitor.php
加一个超链接,可方便地接入你们的自动化运维平台里。