-
Showcases the monitoring of Kafka Streams Metrics
-
The origional version of this project was the basis for a Kafka Summit Europe 2021 presentation titled, What is the State of my Kafka Streams Application? Unleashing Metrics.. It has had a few major revisions since that presentation.
-
It extensively leverages Docker and Docker Compose.
-
Applications are built with Java 14 and run on a Java 17 JVM.
-
Kafka leverages Confluent Community Edition containers, which run with a Java 11 JVM.
-
Setup and Configuration all in the
./scripts/startup.shscript; execute from root directory to get everything running. -
Shut it all down, use
./scripts/teardown.shscript. -
Grafana Dashboard
https://localhost:3000- Credentials:
- username:
admin - password:
grafana
- username:
There are 9 Kafka Streams dashboards as part of this project.
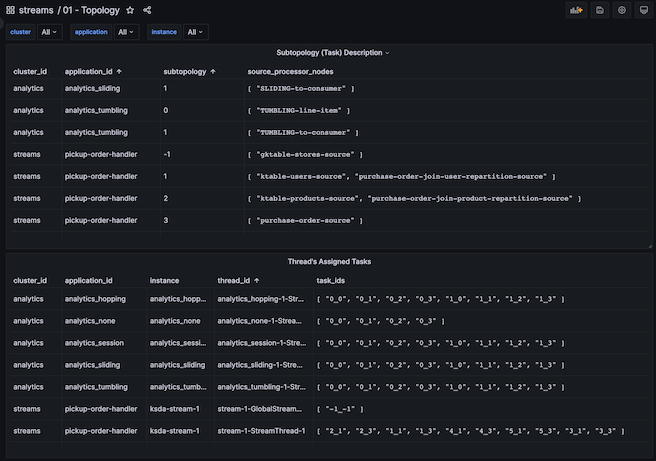
- This dashboard will give you insights into the Kafka Streams Topology along with the instance/thread a task is assigned.
- Aids greatly in understanding the task_id (subtopology_partition) used by other dashboards.
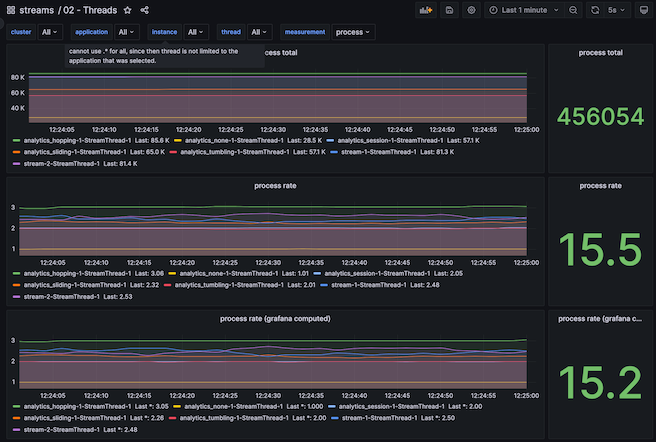
- Process, Commit, Poll statistics on each thread.
- The graph will keep thread/instances separated while the number is total (of what is selected).
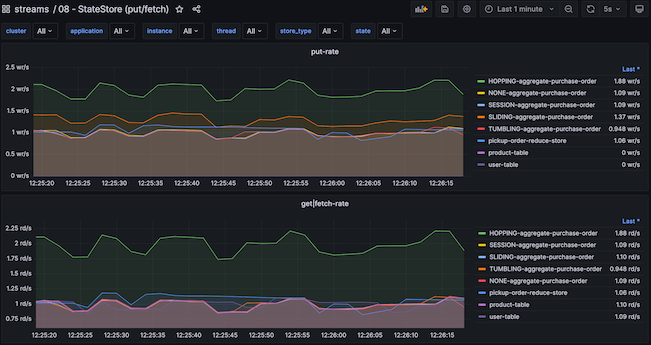
- Shows the put, get/fetch, delete, and count statistics into a single dashboard.
-
This project leverages docker and docker compose for easy of demonstration.
-
to minimize having to start up all components, separate
docker-compose.ymlfor each logical-unit and a common bridge networkksd. -
docker compose .env files used to keep container names short and consistent but hopefully not clash with any existing docker containers you are using.
-
Kafka Brokers name/ports
broker internal (container) bootstrap-servers external (host-machine) bootstrap-servers broker-1 broker-1:9092 localhost:19092 broker-2 broker-2:9092 localhost:29092 broker-3 broker-3:9092 localhost:39092 broker-4 broker-4:9092 localhost:49092 -
The Kafka applications can run on the host machine utilizing the external names, the applications can run in containers using the internal hostnames.
-
To see the Kafka Streams applications in the dashboard, they must be running within the same network; the
applicationsproject does this. -
Each application can have multiple instances up and running, there are 4 partitions for all topics, so for instances are possible.
-
A single Docker image is built to run any application, this application has the JMX Prometheus Exporter rules as part of the container, it also has a health-check for Kafka streams that leverages jolokia and the
kafka-metrics-countmetric. -
To improve startup time of the applications, the Docker image preloads the jars for
kafka-clientsandkafka-streamsand excludes them from the distribution tar. with RocksDB being a rather large jar file, this has shown to greatly improve startup time as the image needs to untar the distribution on startup. -
To reduce build times, the Docker image is only built if it doesn't exist or if
-Pforce-docker=trueis part of the build process.
-
In addition to Kafka Streams Metrics, this project has examples on best-practices for working with Kafka Streams and building out some ideas of making your deployments easier.
- leaving group on close, even with stateful-sets
- how to use environment variables to overide stream settings
- naming your processors
- naming your state-stores
-
The primary software libraries used in addition to Apache Kafka Client and Streams Libraries.
-
FasterXML Jackson
-
Lombok
-
JCommander
-
Slf4j API
-
Logback
-
Apache Commons
- lang3
- csv
-
The tools project provides custom deserializers to use to inspect key elements on a change-log topic.
scripts/enable-custom-tools-derserialerwill create a symbolic link to the tools jar file. This allows forkafka-console-consumerto utilize those deserializers. Inspect the script before running, to understand the modification it will do (expecially if your installation of Apache Kafka is not Confluent's.)
kafka-console-consumer \
   --bootstrap-server localhost:19092 \
   --property print.timestamp=true \
   --property print.partition=true \
   --property print.key=true \
   --property key.separator=\| \
   --key-deserializer=io.kineticedge.ksd.tools.serde.SessionDeserializer \
   --topic analytics_session-SESSION-aggregate-purchase-order-changelog


