We can say that Wireshark is a graphical version of Tshark. Aim of this article is to analyze some attributes of wireless packets captured using tshark on Elasticsearch. Tshark, Elasticsearch, Kibana, Logstash and Filebeat are used to analyze. Installation of Elasticsearch, Kibana, Logstash and Filebeat can be found on this link. An alternative solution is Docker.
In a nutshell:
1.Tshark captures wireless packets by using filters.
2.Tshark writes captured wireless packets as .csv.
3.Filebeat listens .csv file sends to Logstash.
4.Logstash filters data again and sends to Elasticsearch.
5.Analyze data by using Kibana. Dashboard, graph etc.
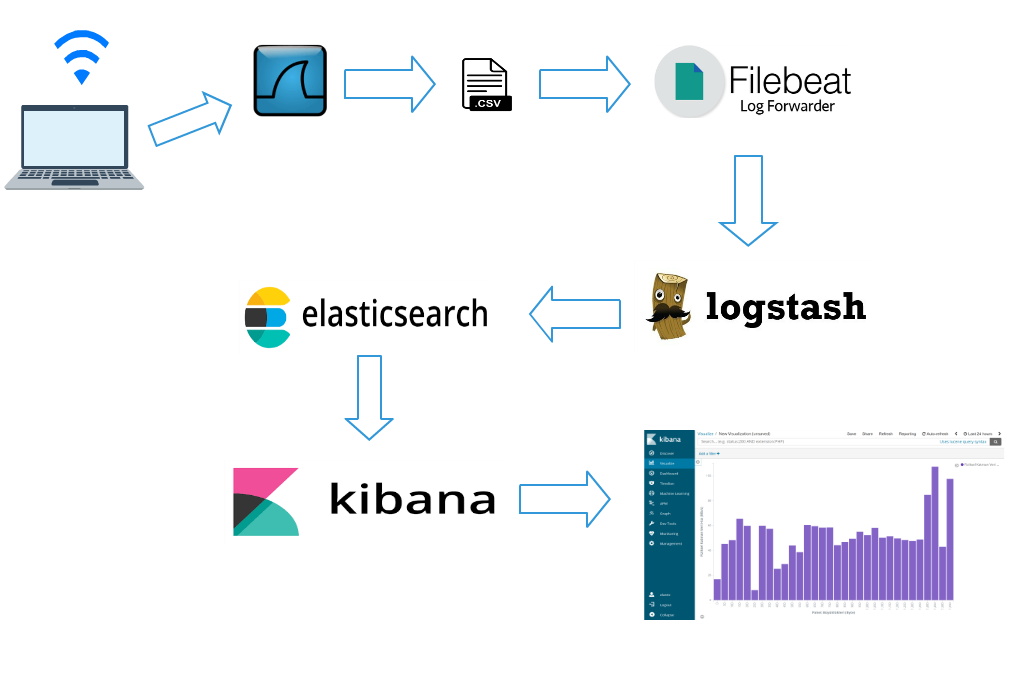
System architecture as the following:
Used filters to analyze wireless packets are as the following:
| Filtre | Description |
|---|---|
| _ws.col.Time | Time info |
| wlan.fc.type | Type |
| wlan.fc.type_subtype | Type/Subtype |
| radiotap.dbm_antsignal | Signal strength(RSSI) |
| frame.len | Frame length |
| radiotap.datarate | Data rate (Mb/s) |
wlan.fc type generate values one of 0,1,2. Meaning of these numbers are as the following:
| Value | Meaning |
|---|---|
| wlan.fc.type==0 | Management Frames |
| wlan.fc.type==1 | Control Frames |
| wlan.fc.type==2 | Data Frames |
wlan.fc.subtype generate values between 0 and 47. Meaning of all these values are on this link. Meaning of some values are on the table as the following:
| Value | Meaning |
|---|---|
| wlan.fc.type_subtype==8 | Beacon |
| wlan.fc.type_subtype==27 | Request To Send |
| wlan.fc.type_subtype==28 | Clear To Send |
Command with filters:
tshark -a duration:600 -i phy0.mon -t ad -t ad -lT fields -E separator=, -E quote=d -e _ws.col.Time -e wlan.fc.type -e wlan.fc.type_subtype -e radiotap.dbm_antsignal -e frame.len -e radiotap.datarate > tshark.csv
-a duration:600 capture wireless packets during 600 seconds
-i phy0.mon select interface that capture wireless packets. Might be diffrent on you.
-t ad time format. YYYY-MM-DD is selected here.
> tshark.csv name of output file.
Remainings are about how to separate attributes.
Tshark listen tshark.csv and sends to Logstash. Your filebeat.yml configuration file should be as the following:
filebeat.modules:
- module: system
  syslog:
    enabled: false
  auth:
    enabled: true
    var.paths: ["/home/tshark.csv"]
name: test
output.logstash:
  hosts: ["localhost:5044"]
Link filebeat.yml
var.paths: ["/home/tshark.csv"] path of your .csv file. Need to be changed according to your .csv path.
You might access to filebeat.yml in Filebeat installation folder on Windows.
Path of filebeat.yml on linux systems :
cd /etc/filebeat
sudo vim filebeat.yml
We have configured Filebeat to send data to localhost:5044 on second step. We have to get this data from localhost:5044 by using Logstash. To do this we need to configure Logstash.yml input as the following:
input {
  beats {
    port => 5044
  }
}
We have to put some filters on Logstash.yml to send Elasticsearch properly. I give filters step by step. You can find Logstash.yml at the end of this section.
We give name to attributes as the following:
   csv {
     source => "message"
     columns => [ "col.time","frame.type","frame.subtype","rssi","frame.size","data.rate" ]
   }
We configure time format as the following
date {
             match => [ "col.time", "YYYY-MM-DD HH:mm:ss.SSSSSSSSS" ]
             target => "@timestamp"
             }
We add some new attributes to our data set as the following:
mutate {
add_field => {"[hour]" => "%{+HH}"}
add_field => {"[minute]" => "%{+mm}"}
add_field => {"[second]" => "%{+ss}"}

}
We convert some attributes to integer to get statistical results as the following:
mutate {
     convert => [ "rssi", "integer" ]
     convert => [ "frame.size", "integer" ]
     convert => [ "data.rate", "integer" ]
     convert => [ "second", "integer" ]
     convert => [ "minute", "integer" ]
     convert => [ "hour", "integer" ]

   }
We convert numbers to meaningful results as the following:
   if[frame.type]=="0"{
   mutate {
     replace => [ "frame.type", "Management" ]
   }}
   if[frame.type]=="1"{
   mutate {
     replace => [ "frame.type", "Control" ]
   }}
   if[frame.type]=="2"{
   mutate {
     replace => [ "frame.type", "Data" ]
   }}
We need to send data to Elasticsearch as the following:
output {
  elasticsearch {
    hosts => ["http://localhost:9200"]
    index => "%{[@metadata][beat]}-%{+YYYY.MM.dd}"
    document_type => "%{[@metadata][type]}"
  }
}
If you are using x-pack security you need to put user and password areas on Logstash.yml as the following:
output {
  elasticsearch {
    hosts => ["http://localhost:9200"]
    index => "%{[@metadata][beat]}-%{+YYYY.MM.dd}"
    document_type => "%{[@metadata][type]}"
    user => elastic
    password => changeme
  }
}
When we finish to configure It should be : Logstash.yml.
If it doesn't work, create a new Logstash.conf and copy content of Logstash.yml into this file. Copy newly created Logstash.conf into bin folder in which Logstash installation folder. Run logstash with newly created Logstash.conf file as the following:
./logstash -f Logstash.conf
-f indicates configuration file.
In brief, after we have configured our tools we start to capture wireless packets by using tshark:
tshark -a duration:600 -i phy0.mon -t ad -t ad -lT fields -E separator=, -E quote=d -e _ws.col.Time -e wlan.fc.type -e wlan.fc.type_subtype -e radiotap.dbm_antsignal -e frame.len -e radiotap.datarate > tshark.csv
We start Elasticsearch, Kibana, Logstash and Filebeat.
For linux systems :
sudo systemctl start elasticsearch.service kibana.service logstash.service filebeat.service
Data will be indexed in Elasticsearch after while a time. We can create a new index pattern as the following: Management>Index Patterns >Create Index
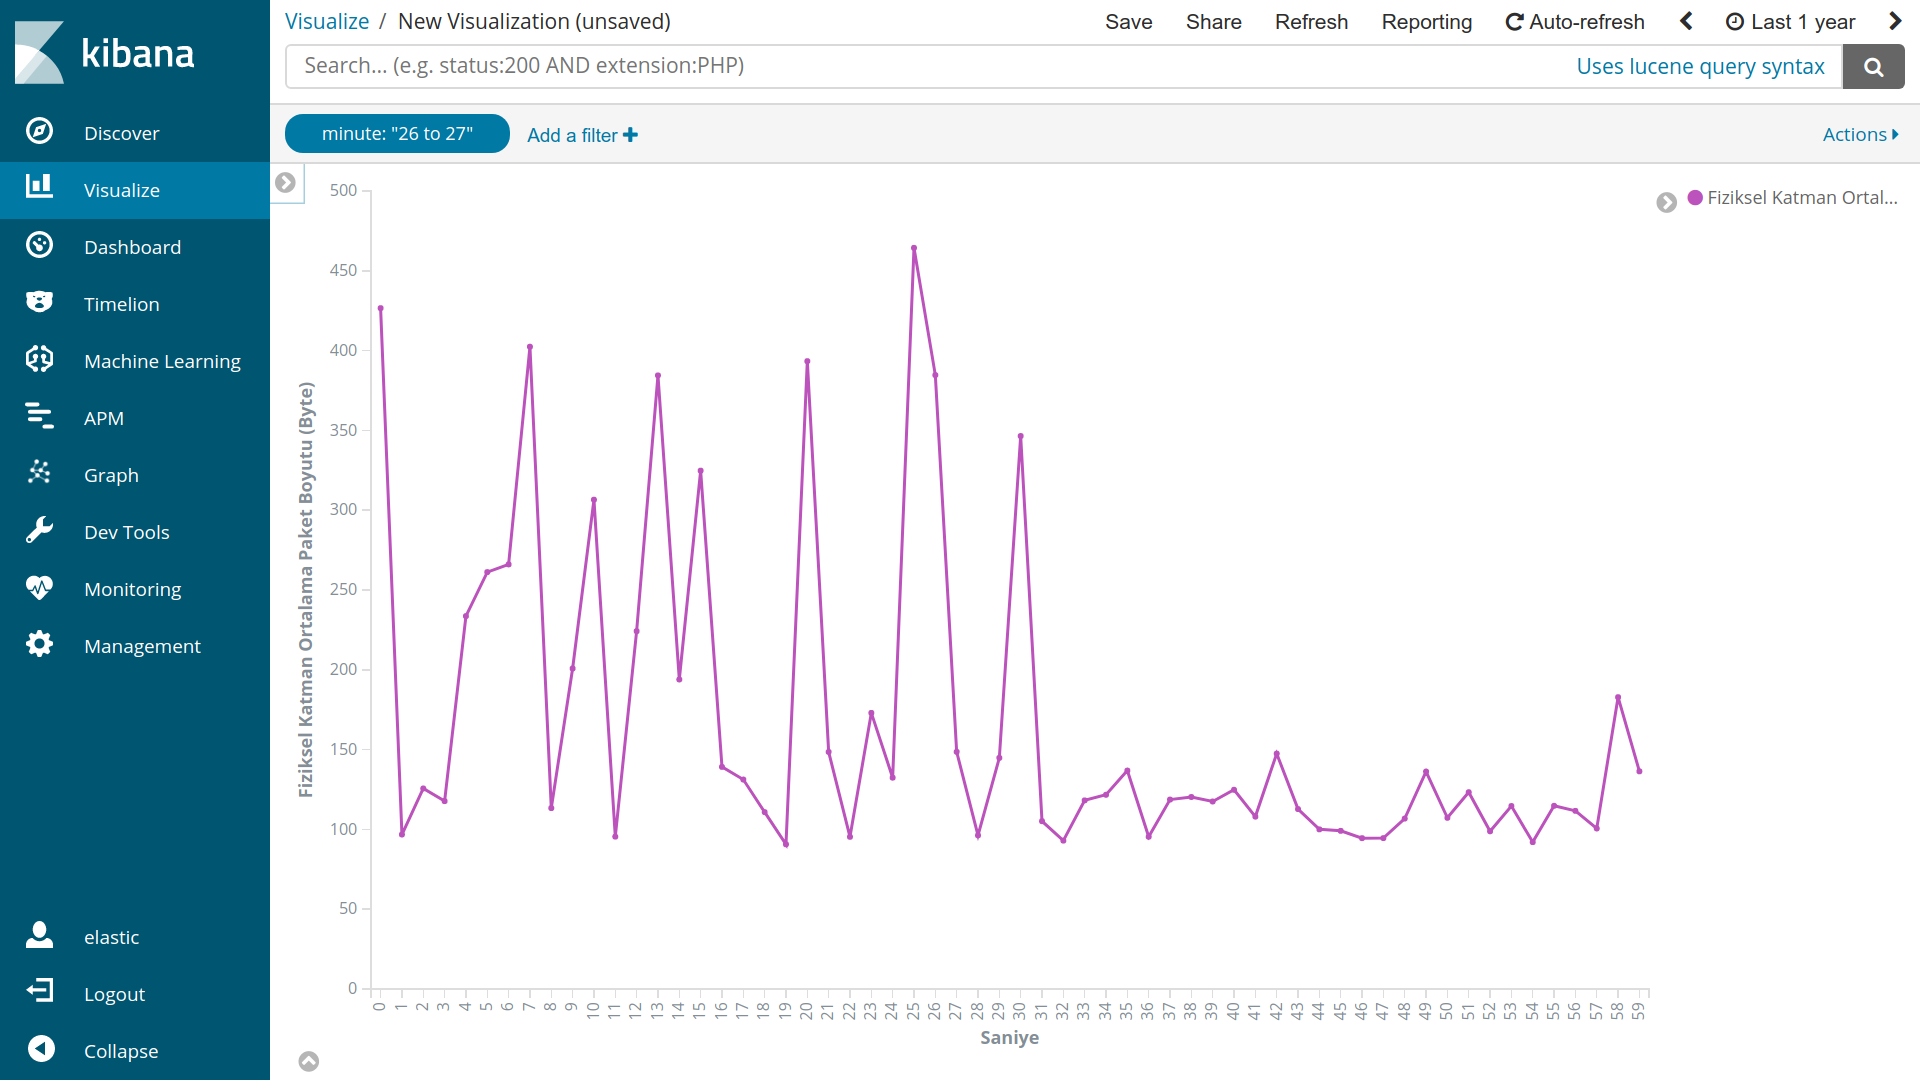
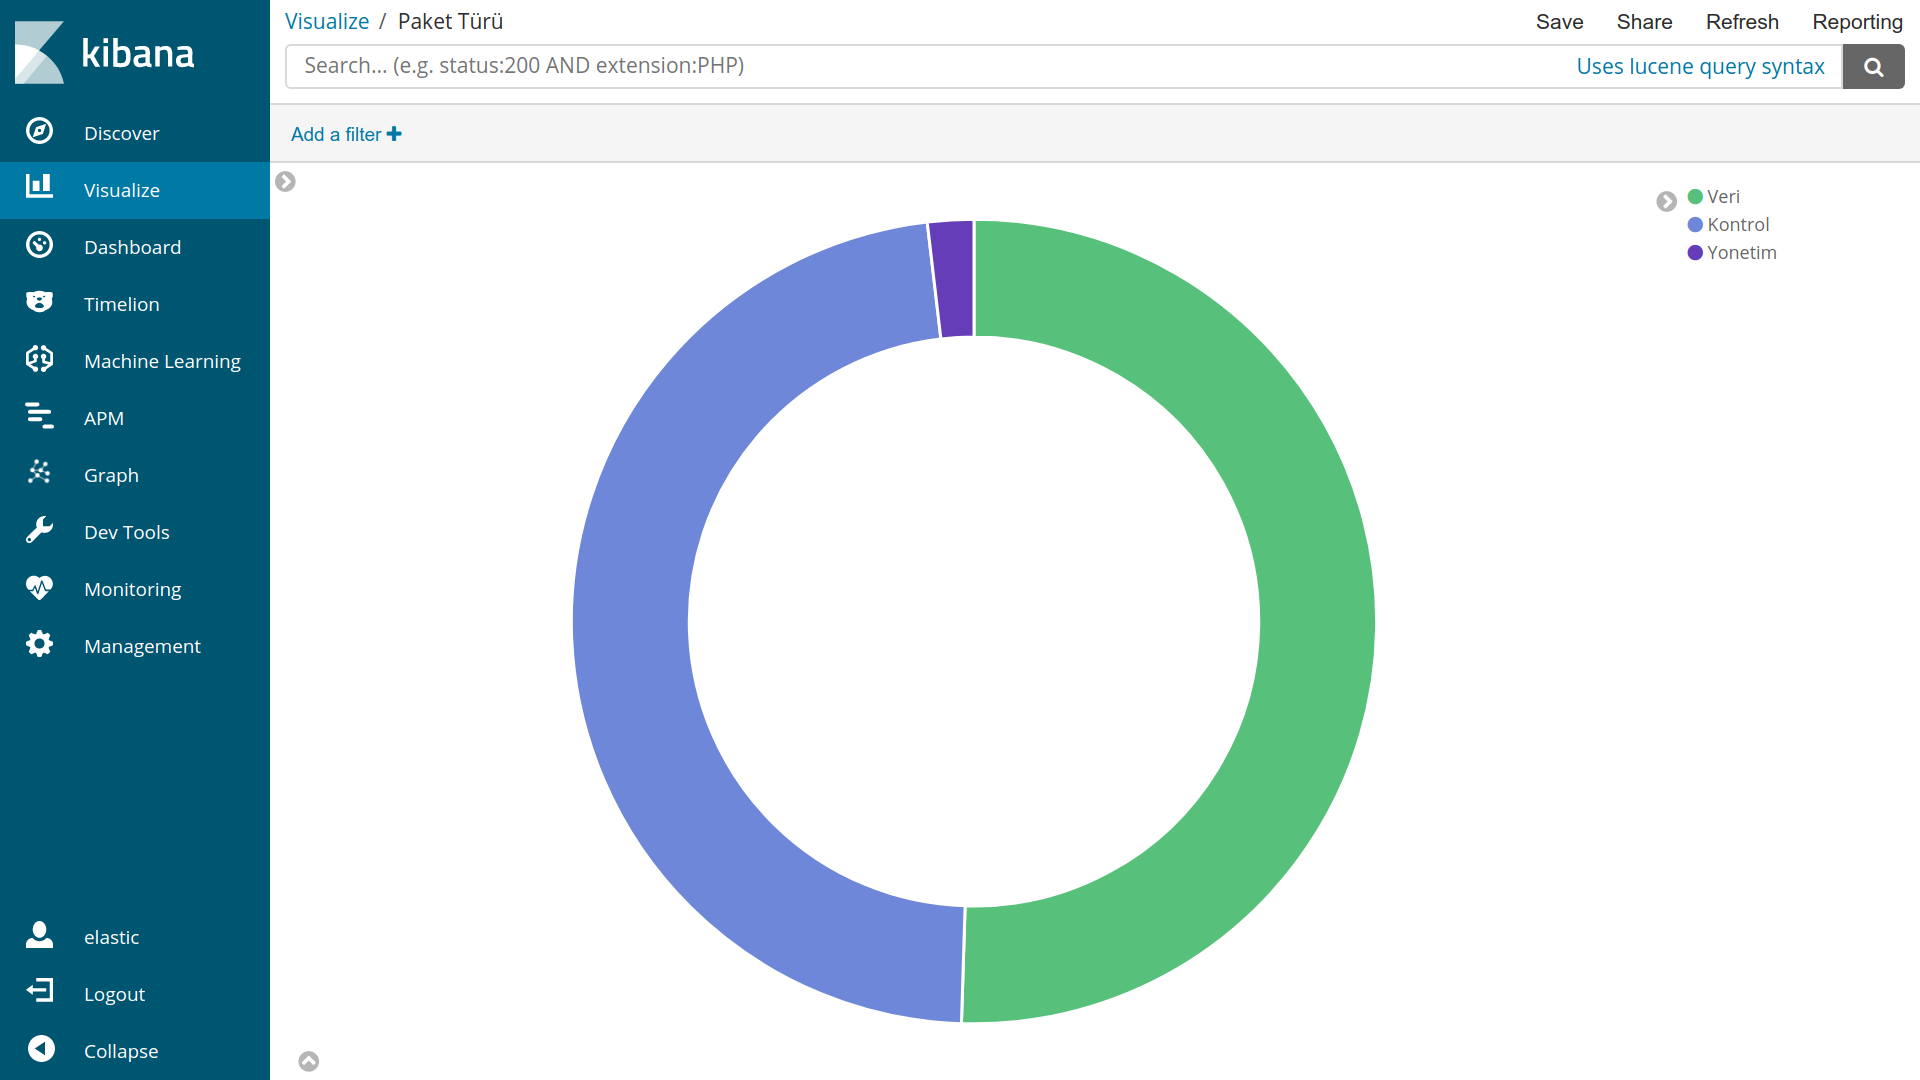
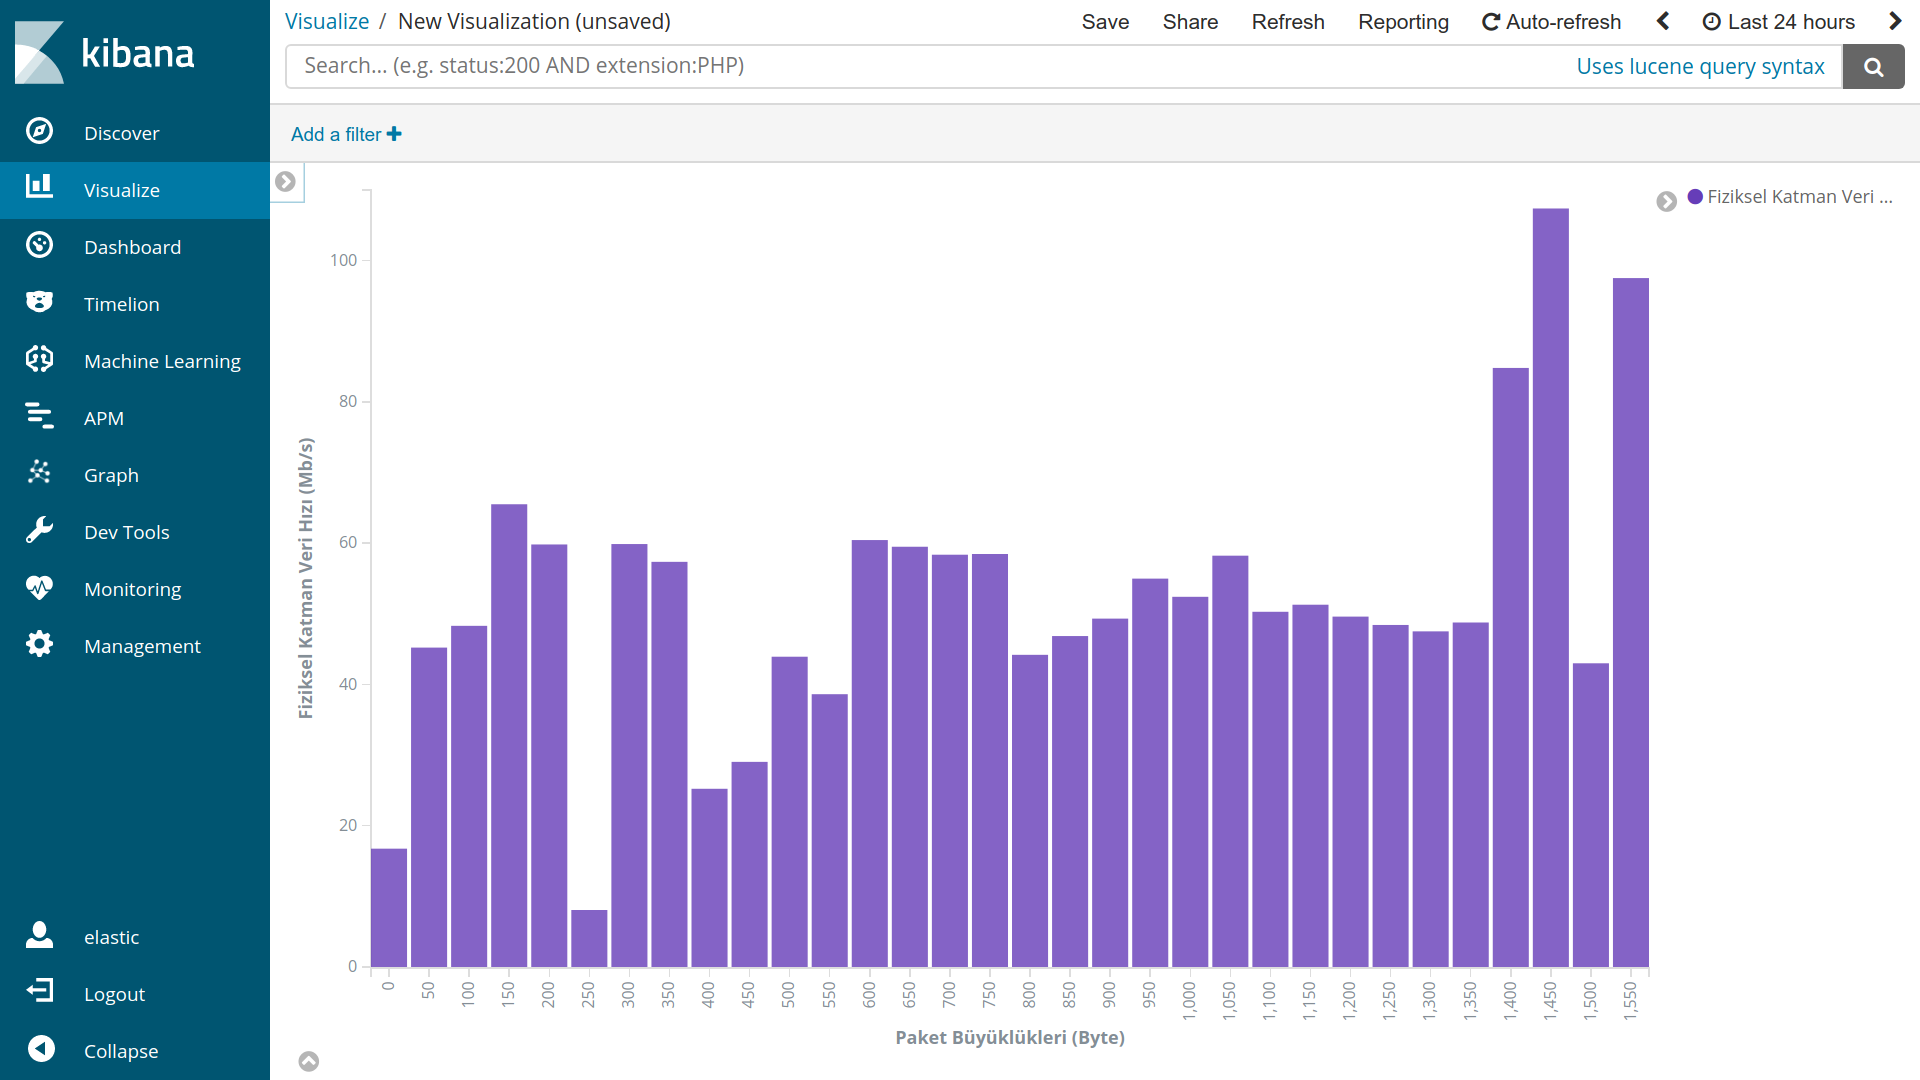
Now we can analyze data from Visualize tab.
Examples:
https://rudibroekhuizen.wordpress.com/2016/02/12/analyse-tshark-capture-in-kibana/
https://dalewifisec.wordpress.com/2014/04/29/wireshark-802-11-display-filters-2/
Tshark'ın Wireshark konsol arayüzü ya da Wireshark'ın tsharkın grafik arayüzü olan hali olduğu söylenebilir.
Tshark ile yakalanan wireless paketlerinin bazı özelliklerinin analizini Elasticsearch ve araçları yardımı ile yapacağım.
Kullanacağım araçlar Tshark, ElasticSearch ,Kibana, Logstash ve Filebeat olacak. Elasticsearch, Kibana, Logstash ve Filebeat
kurulumu için bu link. Ya da docker kullanarak da halledebilirsiniz. Tshark filtreler kullanarak paketleri yakalayacak csv türünde
dosyaya yazacak. Filebeat dosyayı dinleyecek Logstash'e aktaracak. Logstash burada yeniden filtreleme yapacak ve
Elasticsearch'e aktaracak. Kibana kullanarak analizlerimi yapacağım.
Mimarimiz aşağıdaki şekilde olacak:
Wifi paketlerinin analizinde kullanacağım filtreler:
| Filtre | Açıklama |
|---|---|
| _ws.col.Time | Zaman Bilgisi |
| wlan.fc.type | Çerçeve Türü |
| wlan.fc.type_subtype | Çerçeve Alt Türü |
| radiotap.dbm_antsignal | Sinyal Gücü(RSSI) |
| frame.len | Çerçeve Boyutu |
| radiotap.datarate | Veri Akış Hızı |
wlan.fc.type filtresinden gelecek değerler 0, 1, ya da 2 olacak. Bu değerlerin karşılığı:
| Değer | Sonuç |
|---|---|
| wlan.fc.type==0 | Yönetim Çerçevesi |
| wlan.fc.type==1 | Kontrol Çerçevesi |
| wlan.fc.type==2 | Veri Çerçevesi |
wlan.fc.subtype filtresinden gelecek değerler 0 ile 47 arasında değişecek bunlardan bazıları aşağıdaki tabloda kapsamlı olarak buradan ulaşabilirsiniz.
| Değer | Sonuç |
|---|---|
| wlan.fc.type_subtype==8 | Yönetim Çerçevesi |
| wlan.fc.type_subtype==27 | Request To Send |
| wlan.fc.type_subtype==28 | Clear To Send |
Kullanacağım filtre:
tshark -a duration:600 -i phy0.mon -t ad -t ad -lT fields -E separator=, -E quote=d -e _ws.col.Time -e wlan.fc.type -e wlan.fc.type_subtype -e radiotap.dbm_antsignal -e frame.len -e radiotap.datarate > tshark.csv
-a duration:600 10 dakika boyunca paket yakalayacağımı belirtiyorum.
-i phy0.mon paketleri yakalayacak arayüzümü seçiyorum sizde farklılık gösterebilir.
-t ad burada zamanın nasıl yazdırılacağını belirtiyorum. YYYY-MM-DD formatında.
> tshark.csv yakalanan paketlerin yazılacağı dosya otomatik oluşturuyor.
Kalan alanlar kullanılan filtrelerin ne şekilde ayrılacağı ile ilgili.
Filebeat 1.adımda oluşturduğumuz tshark.csv dosyasını dinleyecek ve buradaki değişiklikleri Logstash'e aktaracak. Bunun için filebeat.yml dosyasını aşağıdaki şekilde değiştiriyoruz.
filebeat.modules:
- module: system
  syslog:
    enabled: false
  auth:
    enabled: true
    var.paths: ["/home/tshark.csv"]
name: test
output.logstash:
  hosts: ["localhost:5044"]
İndirme linki filebeat.yml
var.paths: ["/home/tshark.csv"] dosyamızın yolu kendinize göre değiştirin.
Windows sistemlerde filebeat'in kurulu olduğu yerden filebeat.yml dosyasına erişebilirsiniz sanırım.
filebeat.yml dosyasına linux sistemler için aşağıdaki yol ile ulaşabilirsiniz:
cd /etc/filebeat
sudo vim filebeat.yml
3.Logstash'in Filebeat'i Dinlemesi Elastic Searche Yönlendirmesi ve CSV Dosyasına Filtrelerin Uygulanması
2.adımda Filebeat paketleri localhost:5044'e yani Logstash'in çalıştığı sokete yönlendirdi Bu adımda gelen paketleri toplayıp ElasticSearch'e yönlendireceğiz. Logstash.yml dosyasında ilk olarak input kısmını yani filebeatden gelen paketleri topladığımız yeri değiştireceğiz:
input {
  beats {
    port => 5044
  }
}
Daha sonra ise output kısmını Elasticsearche'e yönlendireceğiz:
output {
  elasticsearch {
    hosts => ["http://localhost:9200"]
    index => "%{[@metadata][beat]}-%{+YYYY.MM.dd}"
    document_type => "%{[@metadata][type]}"
  }
}
Eper x-pack security gibi araçlar kullanıyorsanız output kısmına kullanıcı adı ve şifre girmeniz gerekecek:
output {
  elasticsearch {
    hosts => ["http://localhost:9200"]
    index => "%{[@metadata][beat]}-%{+YYYY.MM.dd}"
    document_type => "%{[@metadata][type]}"
    user => elastic
    password => changeme
  }
}
En son olarakta verileri analiz edebilmek için filtre kısmını ayarlamamız gerekiyor burada filtreleri parça parça vereceğim bu adım sonunda da logstash.yml dosyasının tamamına ulaşabilirsiniz.
Aşağıdaki filtre ile tshark'da oluşan alanların isimlerini belirliyoruz ve ayırıyoruz.
   csv {
     source => "message"
     columns => [ "col.time","frame.type","frame.subtype","rssi","frame.size","data.rate" ]
   }
Aşağıdaki filtre ile tsharkın ürettiği zaman değerlerini Elasticsearch'de zamana göre analiz yapabilmek için eşitliyoruz:
date {
             match => [ "col.time", "YYYY-MM-DD HH:mm:ss.SSSSSSSSS" ]
             target => "@timestamp"
             }
Aşağıdaki filtre ile veri setimize saat, dakika ve saniye alanlarını ekliyoruz:
mutate {
add_field => {"[hour]" => "%{+HH}"}
add_field => {"[minute]" => "%{+mm}"}
add_field => {"[second]" => "%{+ss}"}

}
Aşağıdaki filtre ile veri setimizdeki değerleri matematiksel işlemler yapabilmek için integer tipine parse ediyoruz.
mutate {
     convert => [ "rssi", "integer" ]
     convert => [ "frame.size", "integer" ]
     convert => [ "data.rate", "integer" ]
     convert => [ "second", "integer" ]
     convert => [ "minute", "integer" ]
     convert => [ "hour", "integer" ]

   }
Aşağıdaki filtre ile çerçevelerin matematiksel karşılıklarını anlamlı veriler haline getiriyoruz.
   if[frame.type]=="0"{
   mutate {
     replace => [ "frame.type", "Management" ]
   }}
   if[frame.type]=="1"{
   mutate {
     replace => [ "frame.type", "Control" ]
   }}
   if[frame.type]=="2"{
   mutate {
     replace => [ "frame.type", "Data" ]
   }}
Logstash.yml dosyasının son hali şu şekilde olmalı: Logstash.yml.
Eğer yukarıdaki gibi Logstash.yml ile çalışmıyorsa. Logstash.conf isimli bir konfigürasyon dosyası oluşturup yukarıdaki Logstash.yml dosyasını içine kopyalayın. Ve logstash dosyalarının kurulu olduğu yerde bin klasörü içinde komut satırından:
./logstash -f Logstash.conf
ile çalıştırın -f hangi konfigürasyon dosyası ile çalışacağını belirtiyor. Burada dosyayı kaydettiğiniz yolu da girmeniz gerekiyor.
Özet olarak yukarıdaki konfigürasyonları yaptıktan sonra tshark ile paketleri topluyoruz.
tshark -a duration:600 -i phy0.mon -t ad -t ad -lT fields -E separator=, -E quote=d -e _ws.col.Time -e wlan.fc.type -e wlan.fc.type_subtype -e radiotap.dbm_antsignal -e frame.len -e radiotap.datarate > tshark.csv
Elasticsearch, Kibana, Logstash ve Filebeat'i aktif hale getiriyoruz.
Yükleme tarzınıza göre değişmekle birlikte linux sistemler için:
sudo systemctl start elasticsearch.service kibana.service logstash.service filebeat.service
Belirli bir süre geçtikten sonra verileri Elasticsearch içinde indekslemiş olacak. Yeni bir index pattern oluşturarak. Management>Index Patterns >Create Index diyerek yeni bir index pattern oluşturduktan sonra Visualize sekmesinden kendinize göre analizler yapabilirsiniz. Örnek analizler:
https://rudibroekhuizen.wordpress.com/2016/02/12/analyse-tshark-capture-in-kibana/
https://dalewifisec.wordpress.com/2014/04/29/wireshark-802-11-display-filters-2/