Morris Lab, University of Toronto. R package for TrackSig, TrackSigFreq.
To cite, please see https://www.biorxiv.org/content/10.1101/260471v3
Coming soon
R >= 3.3.3
This package imports the following other R packages:
- reshape2 >= 1.4.3 (CRAN)
- ggplot2 >= 3.2.0 (CRAN)
- NMF >= 0.21.0 (CRAN)
- assertthat >= 0.2.1 (CRAN)
- BSgenome.Hsapiens.UCSC.hg19 >= 1.4.0 (Bioconductor)
- GenomicRanges >= 1.26.4 (Bioconductor)
- Biostrings >= 2.42.1 (Bioconductor)
- SummarizedExperiment >= 1.4.0 (Bioconductor)
- VariantAnnotation >= 1.20.3 (Bioconductor)
- grid >= 3.3.3 (CRAN)
- progress >= 1.2.2 (CRAN)
devtools::install_github("harrig12/TrackSigFreq-dev")
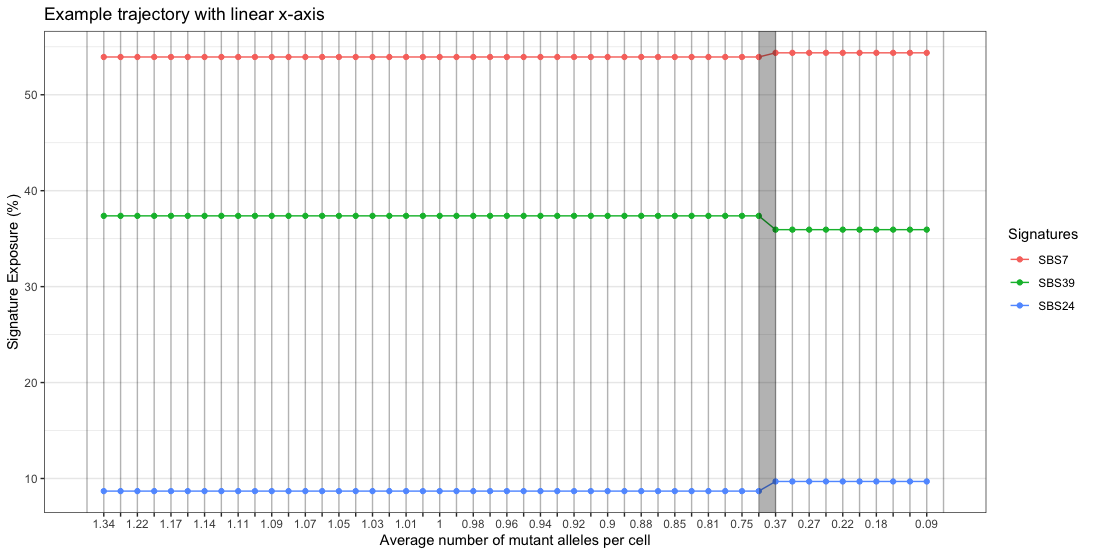
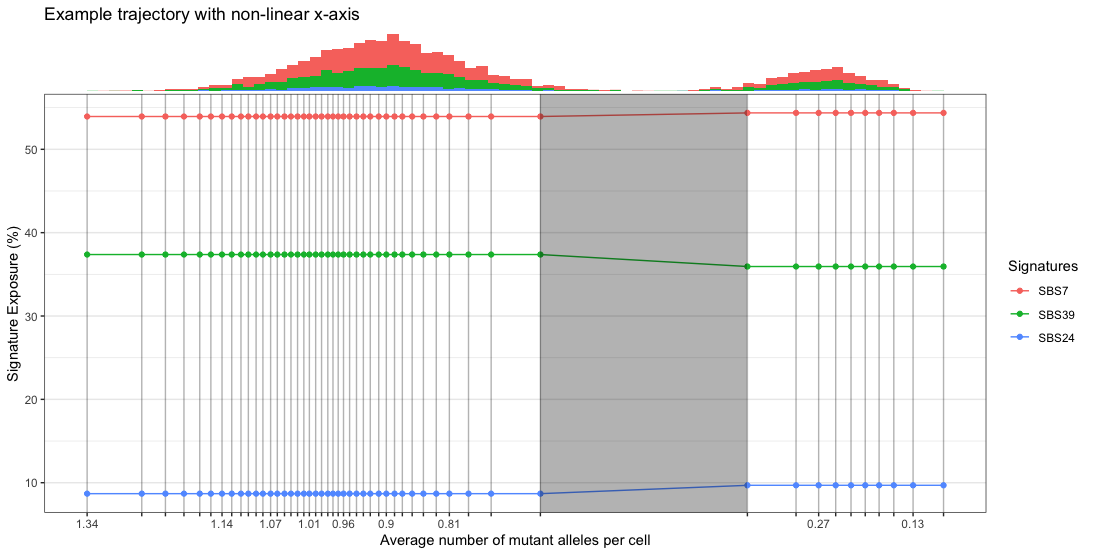
Using the example data provided in extdata/, the following code will plot the signature trajectory, and return the fitted mixture of signatures for each bin, the bins where changepoints were detected, and the ggplot object.
- First, restrict the list of signatures to fit exposure for. This is recommended for improving speed by making the model smaller. Here, we choose a threshold of 5%, meaning that signatures with exposure under this across all timepoints will not be fit.
library(TrackSig)
library(ggplot2)

vcfFile = system.file(package = "TrackSig", "extdata/Example.vcf")
cnaFile = system.file(package = "TrackSig", "extdata/Example_cna.txt")
purity = 1

detectedSigs <- detectActiveSignatures(vcfFile = vcfFile, cnaFile = cnaFile,
purity = purity, threshold = 0.05)- Next, we compute the trajectory for all timepoints.
set.seed(1224)

# a warning will appear about not matching the refrence genome, this is because the
# example vcf file is generated by sampling random nucleotides, not real mutations.
traj <- TrackSig(sampleID = "example", activeInSample = detectedSigs,
vcfFile = vcfFile, cnaFile = cnaFile, purity = purity)- Plot the trajectory. If we plot with non-linear x-axis, then we can use the funciton
addPhiHist()
plotTrajectory(traj, linearX = T) + labs(title = "Example trajectory with linear x-axis")

nonLinPlot <- plotTrajectory(traj, linearX = F) + labs(title = "Example trajectory with non-linear x-axis")
addPhiHist(traj, nonLinPlot)
Some users may have plotting issues with TrackSig if ggplot2 is not explicitly loaded with library(ggplot2). We are experiencing a bug that has been previously described for ggplot2.

