- A Maven plugin that generates dependency graphs in DOT and GML

This Maven plugin generates dependency graphs on single modules or in an aggregated form on multi-module projects. The graphs are represented by .dot or .gml files which can be visiualized by Graphviz or the yEd Graph Editor. In case that Graphviz is installed on the machine where this plugin is run, generated .dot files can be directly rendered into all supported image files. The plugin does also allow you to apply various stylings on the dependency graphs.
For more information take a look at the plugin documentation and the Wiki.
The depgraph-maven-plugin is available on Maven Central. So no further repository configuration is required.
These are the plugin coordinates:
<build>
  <plugins>
    <plugin>
      <groupId>com.github.ferstl</groupId>
      <artifactId>depgraph-maven-plugin</artifactId>
      <version>2.2.0</version>
    </plugin>
  </plugins>
</build>
The release notes can be found in the Wiki
All examples are based on a multi-module project with the following structure:
parent
- module-1
- module-2
- sub-parent
  - module-3
Each of the modules contains some dependencies in different scopes.
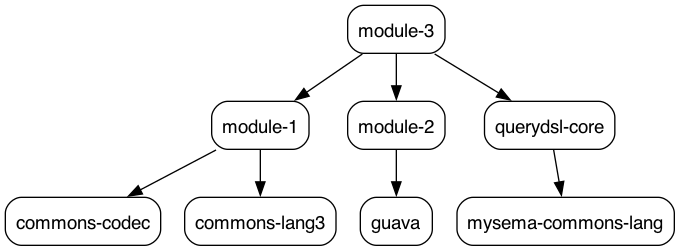
A simple graph can be created by executing the depgraph:graph goal:
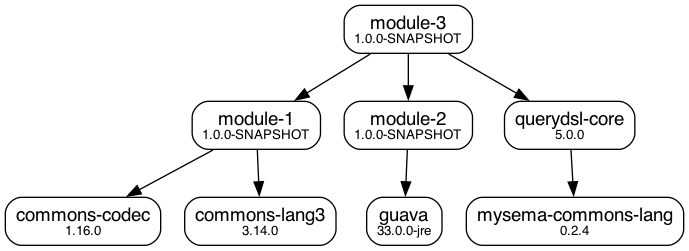
The goal can be configured to show the versions and/or groupIds on the dependencies:
With versions
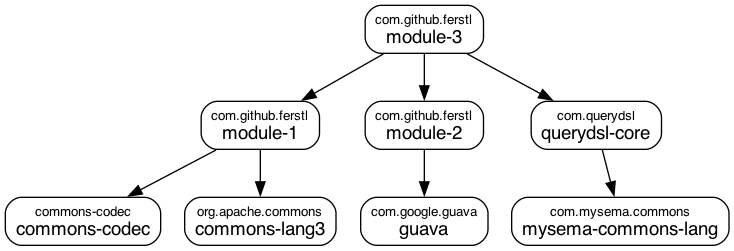
With groupIds
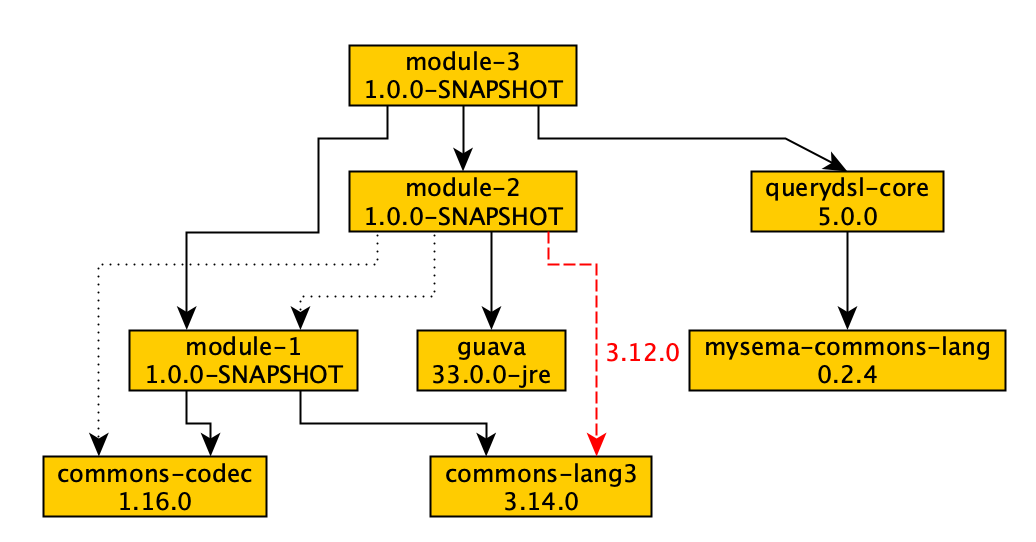
The depgraph:graph goal can be configured to show duplicate and/or conflicting versions. Duplicate versions are shown as dotted black arrows. Conflicting versions are shown as dashed red arrows:
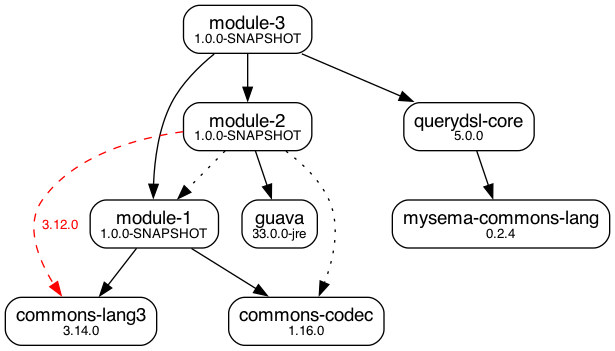
Duplicate dependencies do occur when more than one module defines the same dependency, which is not a problem. Maven's dependency resolution will just pick one dependency and omit all the duplicates. A conflict occurs when the same dependency occurs in different versions in the reactor. In this case Maven will choose the nearest version and ommit the others. Occurrences of conflicting versions should be investigated and solved if possible.
The depgraph:by-groupid goal creates a dependency graph using the groupId of the dependencies:
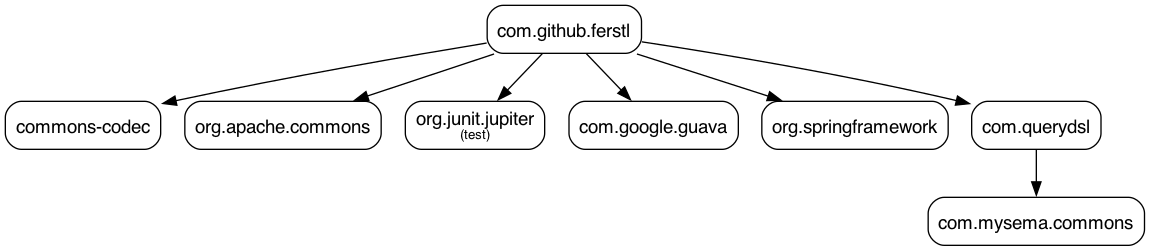
Such graphs give a higher-level overview of a project, i.e. they show better which "frameworks" used by a maven project.
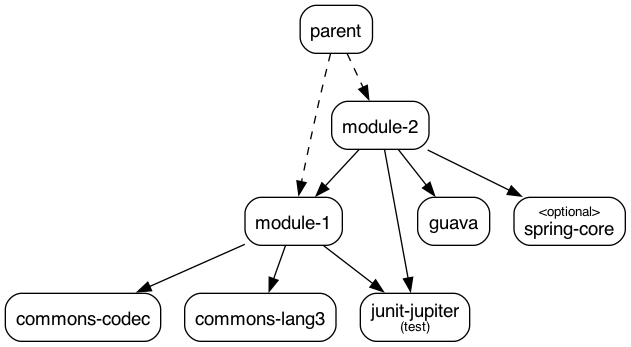
The goals depgraph:aggregate and depgraph:aggregate-by-groupid create aggregated dependency graphs on the root of a multi-module project. They show the union of all the modules' dependencies. Here is an example of an aggregated graph, which connects the parent project and its modules with dotted black arrows (the sub-parent and its module-3 were excluded from the graph for clarity):
The goal depgraph:aggregate-by-groupid does the same for the group IDs of all modules and their dependencies.
This maven plugin offers you a variety of styling options for graphs in the DOT format. These options are explained in detail on the Styling Wiki page. This is an example of the aggregated graph with some custom styles:
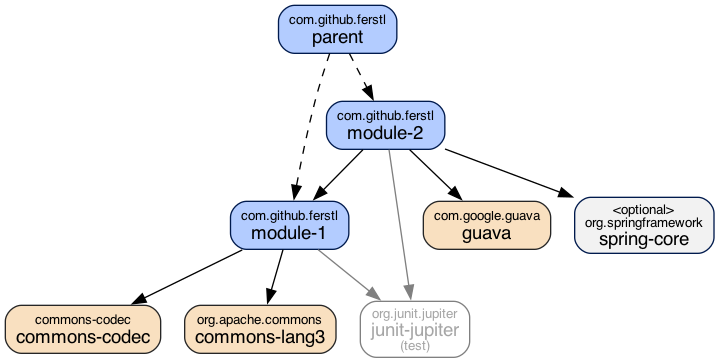
It shows all dependencies with group ID com.github.ferstl with a blue background, all test dependencies with grey text and all other dependencies with grey background.
The GML graph format (set the graphFormat property to gml) allows visualizing a dependency graph in the yEd Graph Editor.
Since the generated dependency graph does not store any layout information, you need to layout the graph in yEd:
- Choose Tools -> Fit Node To Label and press OK in the upcoming dialog
- Choose your layout algorithm in the Layout menu to layout the graph
Q: Help! The dependency graph of my 10 year old 100-module enterprise project looks like a ball of wool. I can't see anything!
A: Think carefully what information you want to see in your dependency graph. Do you really want to have all third-party dependencies in your graph or do you want to see only the dependencies between your own modules? Would the groupId graph be a better alternative?
Generally, you should consequently exclude dependencies that don't give you useful information. The inclusion/exclusion mechanisms in this plugin are quite powerful and easy to use. A good starting point is the exclusion of dependencies to "utility" libraries, such as commons-lang, guava or my-enterprise-project-common. Such dependencies are typically used by every single module which is (in most cases) perfectly fine. So they don't give you much useful information when they show up in the dependency graph.
Q: Why can't I show duplicates and conflicts in the aggregated graph.
A: This does not make sense because dependencies are resolved individually for each module in the reactor. As a result, the same dependency edge in the graph could once occur as conflict, once as duplicate and once as resolved dependency.
Example:
Suppose, we have two modules module-1 and module-2 in the reactor. module-2 has a dependency to module-1 and both modules have a dependency to the third-party library commons-wtf. module-1 references version 3.0 of this library and module-2 references version 3.1. If we now would display conflicts in the aggregated graph, we would get these edges (amongst others):
module-1 --- 3.1 (included) ---> commons-wtf  (perspective of module-1)
module-1 --- 3.1 (conflict) ---> commons-wtf  (perspective of module-2)
module-2 --- 3.0 (included) ---> commons-wtf  (perspective of module-2)
Such a graph is not useful whatsoever. Unless it is not possible to access all resolved dependencies within the whole reactor, we cannot show duplicates and conflicts.
Q: How do the includes/excludes parameters work?
A: Both parameters are a comma-separated list in the form of groupId:artifactId:type:classifier. Not all parts need to be specified and there is wildcard support.
Examples:
- All spring-web* dependencies:
org.springframework:spring-web* - A test jar:
com.mycompany:mylib:jar:tests - The same test jar, but without explicit
typepartcom.mycompany:mylib::tests
A dependency will show up in the graph when it matches the includes list and doesn't match the excludes list.