Uses data scraped from the Greater Chennai Corporation website.
Repository contains the following:
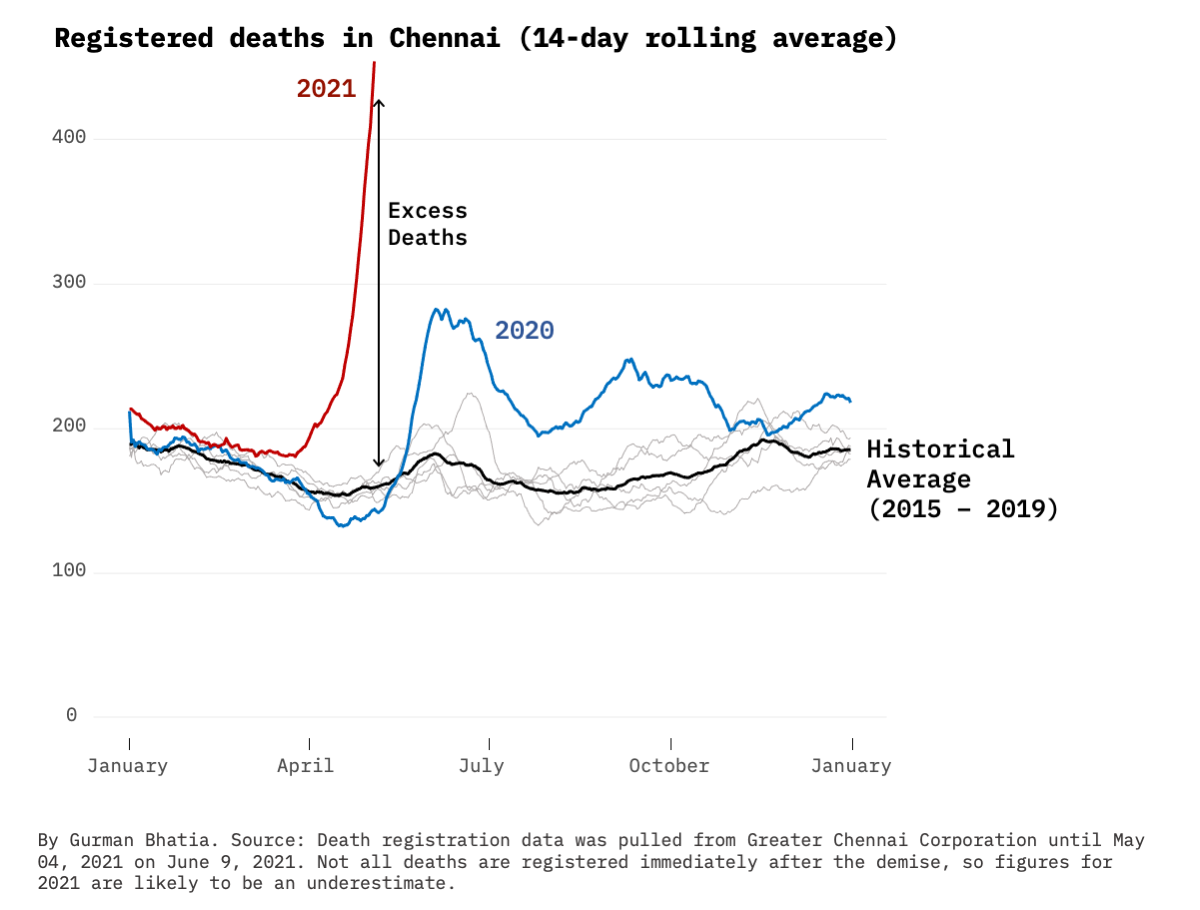
- Registered deaths in Greater Chennai Corporation from 2006 - May 2021.
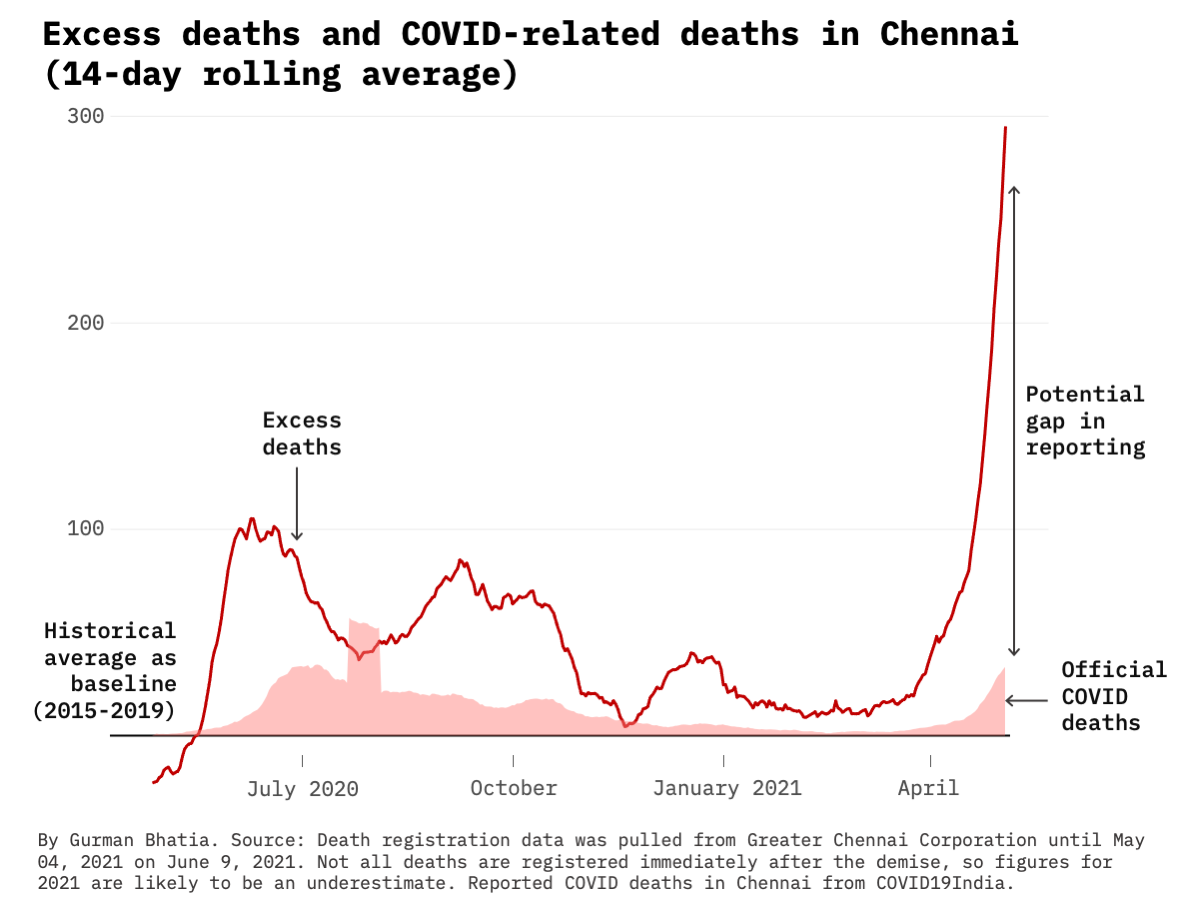
- Excess mortality calculated from registered deaths and compared with reported COVID deaths. Data
- Charts illustrating the extent
Note: All datasheets were last updated on June 16, 2021. As explained by Rukmini S in this story, the data for 2021 is likely to be an underestimate as people have up to an year to register deaths. I plan on updating this repository periodically.
The charts end at May 4, 2021 and are based on data pulled on June 9.
Excess deaths are calculated by taking a historical average to borrow from a normal year and comparing it with a pandemic year to look the extent of deaths that are above the normal.
As the second wave of the pandemic sweeps through the country, and reported numbers are proven to be underreported time and again, excess mortality figures can help us with better estimates of the true toll of the pandemic. This borrows from our experience of previous pandemics, where the recorded number of deaths was much lower than the actual number.
As per data pulled on June 9, for the period between April 27, 2020 and May 04, 2021, Chennai recorded the following numbers
- Registered Deaths: 83,153
- Reported COVID Deaths: 4,879
The 5 year average for the same period between 2015 - 2019 is 63,726 deaths.
Under-reporting factor = (Registered Deaths - Historical Avg) / Reported COVID Deaths
The brings the current under-reporting factor for the city at ~4.
If we compare the same numbers for April 2021:
- Registered Deaths: 8,971
- Reported COVID deaths: 501
- Historical Avg: 4,675
- Under-reporting factor: 8.5
While my calculation is simplistic, Ariel Karlinsky's sophisticated model that accounts for growth, seasonality, other factors, says b/w Apr 4-May 16 - deaths in Chennai were 6.2x of the reported figures. My simple math would place that time period at 7x.
Based on the Economist's Excess Mortality chart. See how to read the chart here.

Another Chennai based doctor has also been scraping the data.
