Linear Regression
Linear Regression | Example code and own notes while taking the course "Intro to Machine Learning" on Udacity.
Performance metrics (In sklearn)
R-squared (sum of the errors) = Performance of your regreession: reg.score()
Slope: reg.coef_
Intercept: reg.intercept_
Errors
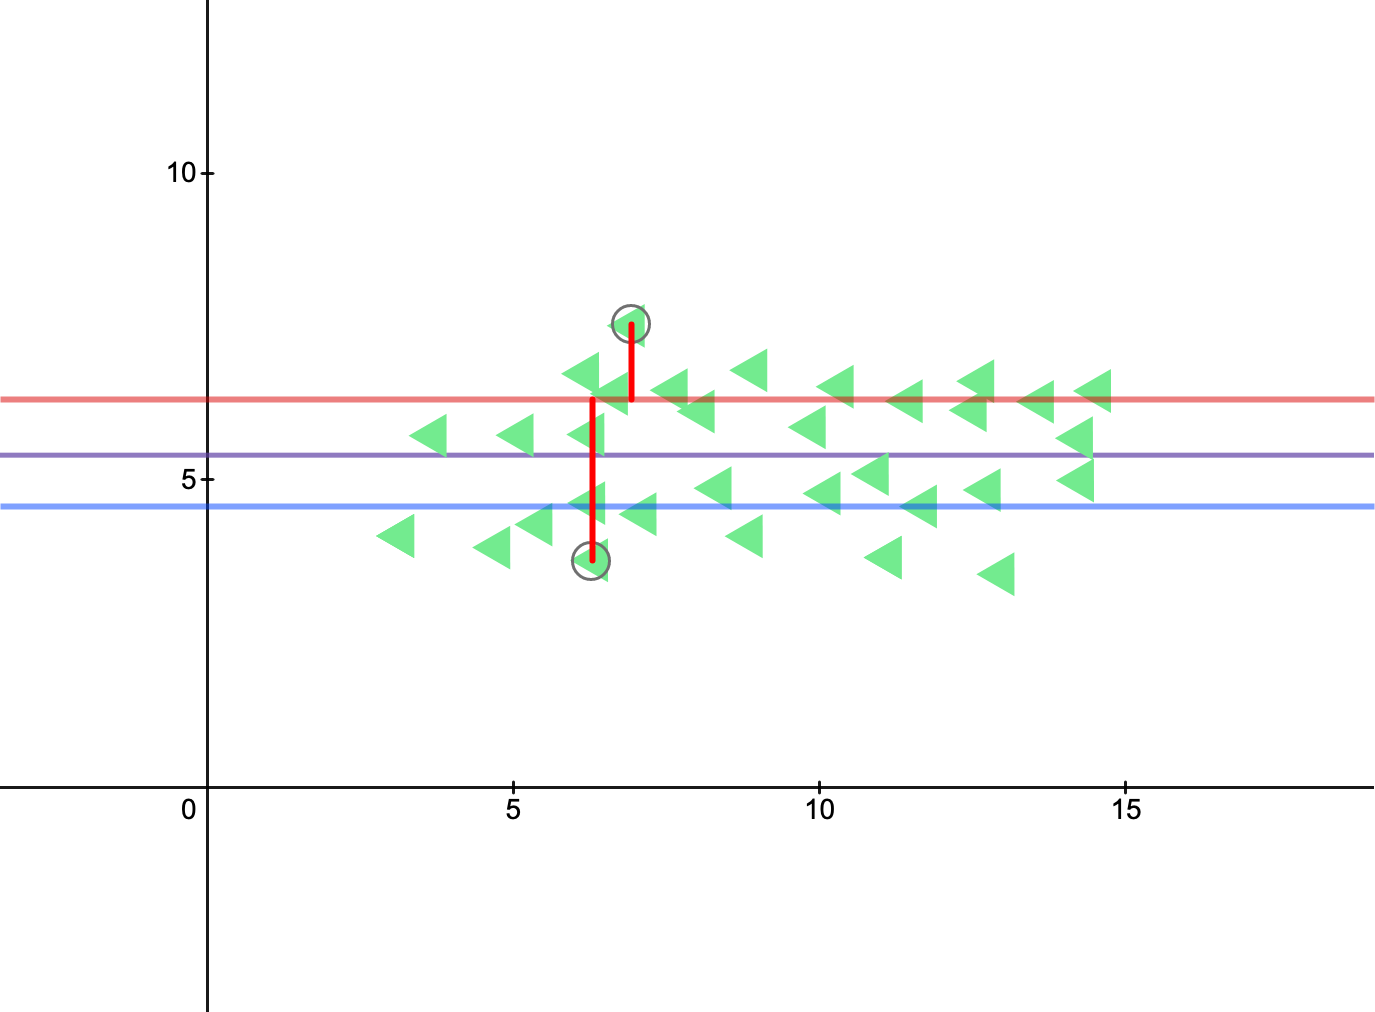
Minimizing the Sum of Squared Errors (SSE)
The best regression is the one that minimizes the sum of squared errors.
-
actual: training points
-
predicted: predictions from regression (
y = mx + b)
There can be multiple lines that minimizes ∑|error|, but only one line will minimize ∑error²!
SSE is an evaluation metric, however, if you have more data you might get larger SSe, so this does not mean that you have worse fit. right?
Several algorithms
- Ordinary last squares (OLS): Used in sklearn linear regression
- Gradient descent
r² ("R-squared") of a regression
How much of my change in the output (y) is explained by the change in my input (x)?
- 0.0: Line isn't doing a good job of capturing trend data
- 1.0: Line does a good job of describing relationship between input(x) and output(y)
R-squared is independent of the number of training points.
Comparing Classification & Regression
| Property | Supervised Classification | Regression |
|---|---|---|
| Output Type | Discrete(class labels) | Continuous (number) |
| What are you trying to find? | Decision boundry | Best fit line |
| Evaluation | Accuracy | Sum of squared error -or- r² |


