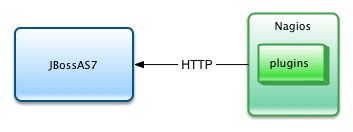
This project provides a Nagios plugin for Wildfly resource monitoring. The plugin uses HTTP-JSON based API (JBossAS REST Management API) to collect server statistics. The plugin supports standalone as well as domain mode.
Other plugins need additional SAR or WAR to be installed on the application server. Typically in Enterprise setups; it is sometimes not allowed to perform any additional installations on the target system. The main advantage of this plugin is it leverages the REST API of JBossAS. This allows us to monitor the application server without any additional configurations and installations.
-
Nagios
-
Python 3 onwards (with requests module used for digest authentication)
-
JBossAS 7.1, JBoss EAP 6 or Wildfly 8 onwards
The check script supports following options. Details about monitoring different resources is available in respective sub-sections.
server:nagios-plugin-jbossas7 Aparna$ python check_jbossas7.py --help
Usage: check_wildfly.py [options]

This Nagios plugin checks the health of JBossAS.

Options:
  -h, --help            show this help message and exit
  -H HOST, --host=HOST  The hostname you want to connect to
  -P PORT, --port=PORT  The port JBoss management console is runnung on
  -u USER, --user=USER  The username you want to login as
  -m MODE, --mode=MODE  The mode the server is running (standalone or domain)
  -n NODE, --node=NODE  The node if the server is running in domain mode
  -i INSTANCE, --instance=INSTANCE
                        The instance if the server is running in domain mode
  -p PASSWD, --pass=PASSWD
                        The password you want to use for that user
  -W WARNING, --warning=WARNING
                        The warning threshold we want to set
  -C CRITICAL, --critical=CRITICAL
                        The critical threshold we want to set
  -A ACTION, --action=ACTION
                        The action you want to take
  -D, --perf-data       Enable output of Nagios performance data
  -m MEMORY_POOL, --memorypool=MEMORY_POOL
                        The memory pool type
  -q QUEUE_NAME, --queuename=QUEUE_NAME
                        The queue name for which you want to retrieve queue
                        depth
  -d DATASOURCE_NAME, --datasource=DATASOURCE_NAME
                        The datasource name for which you want to retrieve
                        statistics
  -s DS_STAT_TYPE, --poolstats=DS_STAT_TYPE
                        The datasource pool statistics type
  -t THREAD_STAT_TYPE, --threadstats=THREAD_STAT_TYPE
                        The threading statistics type
If running in domain mode, connect to the domain controller.
Currently the plugin supports monitoring of following resources and sub-systems.
- Server Status
-
Checks JBossAS status
- JVM Memory Utilization
-
Checks Heap, Non Heap, Old Gen, Eden Space, Perm Gen, and Code cache utilization
- Garbage Collection
-
Checks garbage collection rate
- HornetQ Messaging
-
Checks message queue depths
- DataSource Pool Usage
-
Checks datasource pool utilization
- Threading
-
Checks JVM process thread utilization
The project is licensed under the Apache License, Version 2.0
