Seaborn is a Python visualization library based on matplotlib. It provides a high-level interface for drawing attractive statistical graphics.
Online documentation is available here. It includes a high-level tutorial, detailed API documentation, and other useful info.
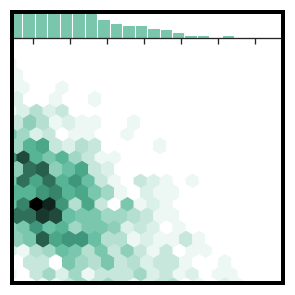
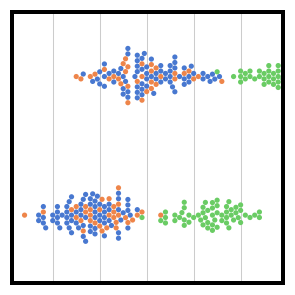
The documentation has an example gallery with short scripts showing how to use different parts of the package.
Seaborn can be cited using a DOI provided through Zenodo:
- Python 2.7 or 3.4+
To install the released version, just do
pip install seaborn
You may instead want to use the development version from Github, by running
pip install git+https://github.com/mwaskom/seaborn.git#egg=seaborn

To test seaborn, run make test in the source directory. This will run the
unit-test and doctest suite (using nose).
https://github.com/mwaskom/seaborn
Please submit any bugs you encounter to the Github issue tracker.
Released under a BSD (3-clause) license
"Those are nice plots" -Hadley Wickham