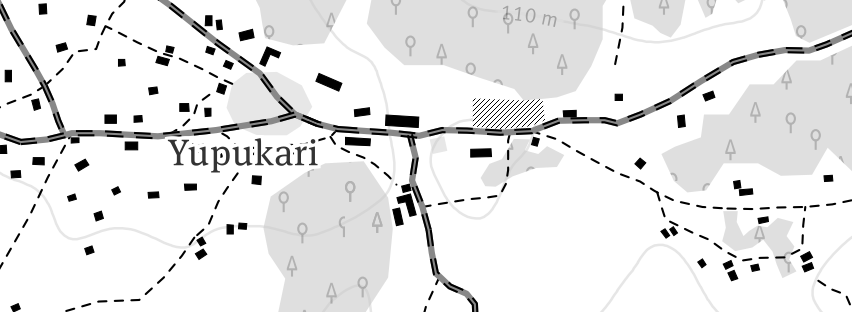
Ethnocart is a map style for use with Mapbox Studio based on the Mapbox High Contrast style. It's intentionally made in a way that more information is displayed than is customary for maps intended to be used for web display. This means that when looking at populated areas the information displayed will likely be too detailed but it should be about right when looking at remote areas.
Download the latest version and save the tm2 folder anywhere you want to use it. Make sure the downloaded folder has the .tm2 extension. Create an account with MapBox and download Mapbox Studio. Run Mapbox and open the tm2 folder.
You can save a local place of interest which allows you to quickly return to that area by clicking the heart icon in the top bar of the window. There are currently a couple of places saved which will give you an idea of how the map looks when looking at remote areas.
If the information you want to add or edit is of general interest - such as buildings, local shops or roads - then it is better to edit the informaion in OpenStreetMap. This will ensure that the local community will be able to use the information you add as OpenStreetMap is used in many applications. There is a beginners guide available on the OSM wiki and using the iD editor is recommended as you can put on a satellite overlay to help with adding data.
If the information you want to add is only of interest to your one map then you should add this as a local data source for Mapbox Studio.
The basic idea is that you will use a geoJSON editor to add markers, lines and polygons that are used.
There are three files in the _doc/geoJSON/ folder. These can act as an example to get the data source working and also as a base to edit any features you want to add.
To add the data source layer:
- Go to the Projects view in Mapbox Studio and click new project and select a blank source.
- Click new layer and add the three files, making sure the names of the layers are
extra,namedMarkersandarea. - Save the source and under settings, upload to Mapbox.
- Once the upload is complete you should have Map ID. Copy this down and switch over to the Ethnocart style.
- Under layers, click change source and add the Map ID from your source to the end of the list. For example:
mapbox.mapbox-terrain-v2,mapbox.mapbox-streets-v5,youruserid.12345678
If you want to update the data then there is no need to redo all the steps.
- Edit the file you want to change in geojson.io or any other editor
- Replace the original file and make sure the name is the same
- Open the previously created data source in Mapbox Studio from the Projects tab under Sources.
- Save and upload to Mapbox.
It will take a small amount of time for the changed data source to be processed. Once it is you will have to refresh the layers in your style to see the new data.
The area file is intended to mark areas and can be turned off with the @showAreas flag.
You can add any polygon shape and it will show up in the map with the colours etc the way you have defined them in geojson.io, or you can use default values by setting @useAreaData to false.
If you want to have a text showing by the area then add a marker with a property name and value what to show. The text will be placed center align at that point.
The extra layer will act as a point where you can add OSM style data points. This is however far from complete and if you want a specific feature then report it as an issue above.
If you just want a marker with icon or text then you can add that and set the marker-symbol property to a text value. You will have to add a SVG file in img/icons/ with the same name. OSM style icons can be found here. The name will be printed if it has a name property.
If you have a marker with a text that gets clipped at high zoom levels, then you will either need to move the point of increase the buffer size for the layer. If you want to increase the buffer size, then this is done by going back to your data source, clicking on the layer and change buffer size there.
