
Dashboard to manage renewable energy, public wifi, renewables, bicycle rental and more for a city.
Explore the docs »
View Live Demo
·
Report Bug
·
Request Feature
Table of Contents
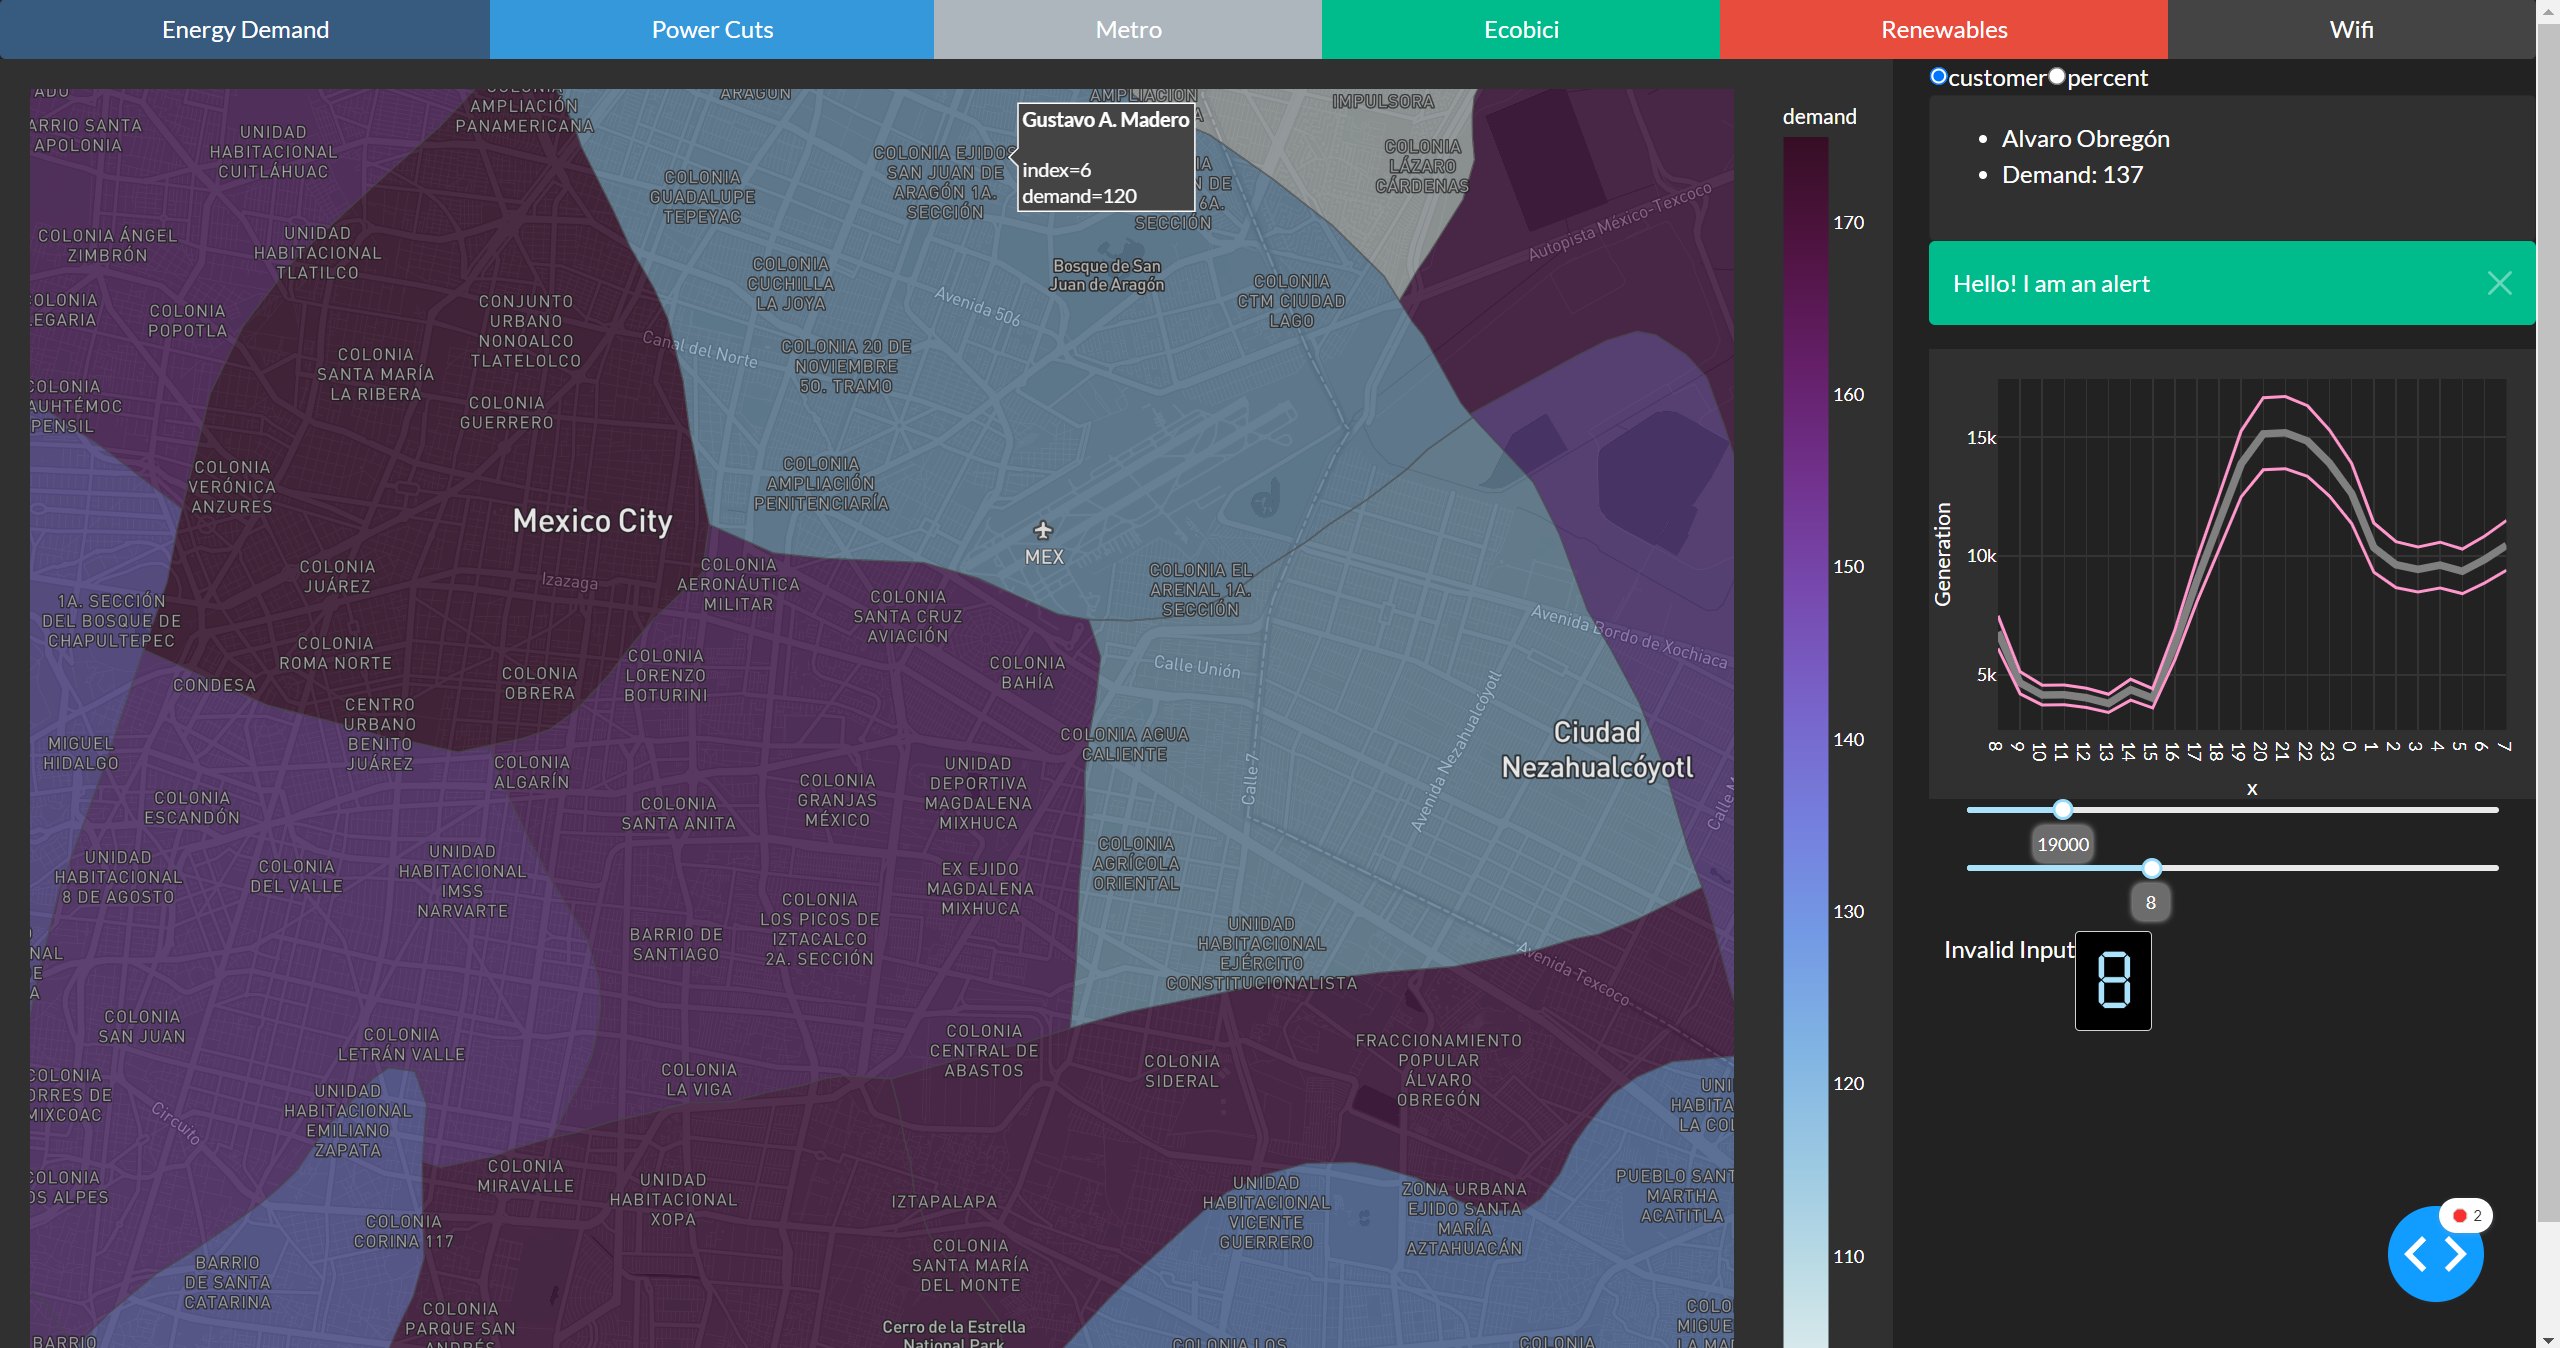
Dashboard with several pages to manage the following in a city. The city for this example if Mexico City.
Page 1 has a map to show Energy Demand for each region of the city.
Page 2 has a map to manage potential power shortages and which parts of the city would be without sufficient energy supply. The slider can be moved to experiment with different power generation.
Page 3 shows demand for today and historically for the Mexico city metro.
Page 4 with a map showing live bicycle sharing stations and their capacity including bikes available.
Page 5 with a map showing the renewable energy providers in the city.
Page 6 shows the wifi stations in the city, showing live demand/capacity.
The advantage of using plotly is everything from the front-end to the back-end is built using python. No need to learn javascript and seamlessly put online with https://pythonanywhere.com (free account to get you going). Pythonanywhere has most python packages installed on their own side so you just need to put your .py file and it should run straight away.
To get a local copy up and running follow these simple example steps.
Install Python (better to use Anaconda https://www.anaconda.com/)
-
Clone the repo
git clone https://github.com/gkennaugh/city.git
-
Install required packages from requirements.txt
pip install -r requirements.txt
-
Download the two largest files from here and store in the same directory as the other files: https://gkennaugh12.eu.pythonanywhere.com/static/merged_stations.csv
-
Run python app.py in a new Anaconda Command Prompt (can take one minute to fully run first time)
python app.py
Open the app in your local browser at http://localhost:8061
N.B. You can use my api key to begin with but please get your own free key here https://www.mapbox.com/
City management dashboard for modern cities with public services such as bicycle rental, wifi towers, public transport and energy demand/shortfall from local renewable sources.
For more examples, please refer to the Documentation
- [-] Map info (location of several city public services)
- [-] Graphs
- [-] Alert notices
See the open issues for a full list of proposed features (and known issues).
Contributions are what make the open source community such an amazing place to learn, inspire, and create. Any contributions you make are greatly appreciated.
If you have a suggestion that would make this better, please fork the repo and create a pull request. You can also simply open an issue with the tag "enhancement". Don't forget to give the project a star! Thanks again!
- Fork the Project
- Create your Feature Branch (
git checkout -b feature/AmazingFeature) - Commit your Changes (
git commit -m 'Add some AmazingFeature') - Push to the Branch (
git push origin feature/AmazingFeature) - Open a Pull Request
Distributed under the GNU General Public License v3.0. See LICENSE.txt for more information.
Your Name - @twitter_handle) - info@oriondvd.co.uk
Project Link: https://github.com/gkennaugh/city